What Can Grocery Price Tracking Using Quick Commerce APIs Reveal About Changing Food Inflation?
Introduction
Food inflation is no longer reflected only through monthly or quarterly indicators. Digital grocery platforms continuously adjust prices according to supply, demand, inventory, location, promotions, and market conditions. This makes Grocery Price Tracking valuable for identifying short-term movements that conventional datasets may capture much later.
Quick commerce platforms provide a closer view of everyday grocery pricing because consumers can see updated prices for essential products throughout the day. Tracking these changes across locations and categories can reveal whether price increases are temporary, seasonal, product-specific, or part of a broader inflationary pattern.
The value becomes stronger when large volumes of historical and current pricing records are organized consistently. FAO reported that global food consumer inflation settled around 3.4% in 2025 after reaching 13% in 2023, showing how quickly food-price conditions can change. Retail-level datasets can add another layer of detail by showing how broader movements appear at the product and location level.
Live Grocery Prices Reveal Emerging Food Inflation Patterns
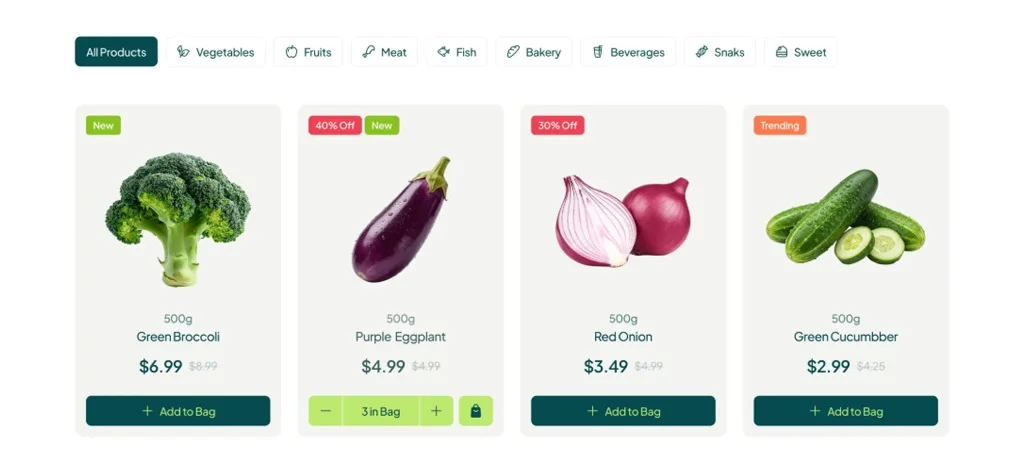
Quick commerce platforms generate frequent pricing observations across essential grocery categories, making them useful for examining how food costs change over short periods. Instead of depending only on periodic market reports, analysts can examine individual products and identify repeated increases or decreases. This provides greater visibility into pricing behavior across staples, packaged goods, fresh produce, dairy, and household essentials.
Within this process, Grocery Price Inflation Tracking can organize repeated observations into comparable time periods. Analysts can examine daily, weekly, or monthly movements and determine whether changes are isolated or recurring across several products. Such analysis can also reveal differences between promotional pricing and regular prices, helping separate temporary discounts from sustained market movement.
A Real-Time Grocery Price Monitoring API can further support automated collection by capturing product-level information at recurring intervals. This allows businesses to maintain structured records containing prices, product names, package sizes, locations, timestamps, and availability. The resulting information can help identify unusual price movements and support faster assessment of emerging inflationary pressure.
Key indicators that can be evaluated include:
- Daily and weekly price changes
- Product-level price fluctuations
- Category-level movement
- Regional pricing differences
- Promotional frequency
- Stock-related price changes
| Indicator | Analytical Purpose |
|---|---|
| Price movement | Measures changes over time |
| Category variation | Identifies affected product groups |
| Location difference | Highlights regional conditions |
| Promotion activity | Separates discounts from regular movement |
| Price volatility | Indicates market instability |
USDA data illustrates the importance of category-level monitoring, with U.S. food-at-home prices increasing 2.3% in 2025, while eggs increased 21.9% and beef and veal increased 11.6%.
Product-Level Pricing Shows Shifting Consumer Cost Pressures
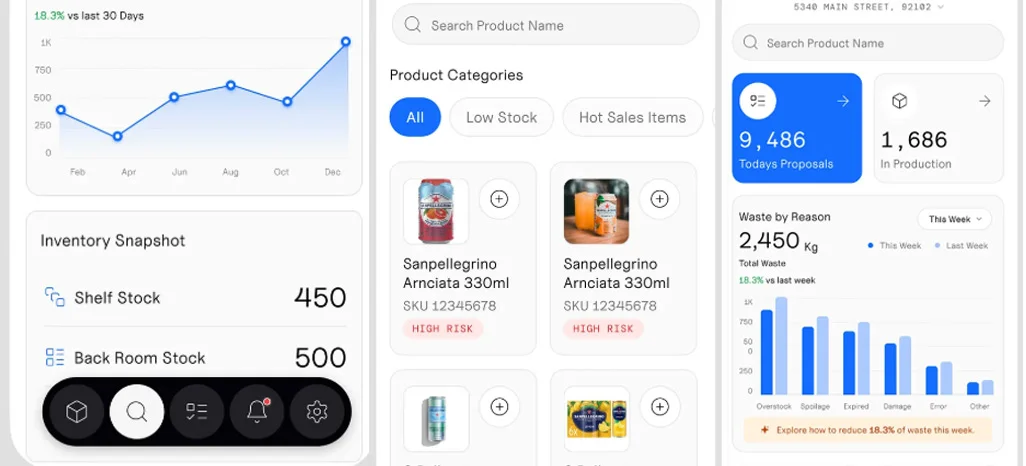
Individual product records can provide context that broad inflation percentages cannot always explain. A category may show moderate overall movement while certain products experience considerably higher increases. Examining product-level prices therefore helps analysts understand which items are creating stronger pressure on household grocery budgets and how those movements vary across different locations.
A structured Grocery Price Data for Inflation Analysis workflow can group products by category, brand, quantity, retailer, and location. These relationships make it easier to compare equivalent products and calculate changes over consistent periods. Analysts can also distinguish branded products from private-label alternatives and evaluate whether consumers have practical substitution options when prices rise.
This type of structured information contributes to stronger Grocery Price Intelligence by connecting individual price observations with broader consumer and market trends. Businesses can examine recurring increases, product volatility, and category concentration while identifying whether pricing pressure is widespread or limited to particular goods. Historical records can also support trend models and recurring reporting.
Useful product-level observations can include:
- Product and brand identification
- Pack size and quantity
- Current and previous prices
- Category classification
- Retailer information
- Geographic availability
| Data Point | Analytical Value |
|---|---|
| Product name | Identifies the tracked item |
| Brand | Enables brand comparison |
| Package size | Supports comparable evaluation |
| Category | Groups related products |
| Location | Shows geographic variation |
FAO reported that global food consumer price inflation declined from 13% in 2023 to 3.1% in 2024 and approximately 3.4% in 2025. Detailed retail observations can help explain how such broader movements translate into individual product pricing.
Cross-Retailer Comparisons Clarify Changing Market Conditions
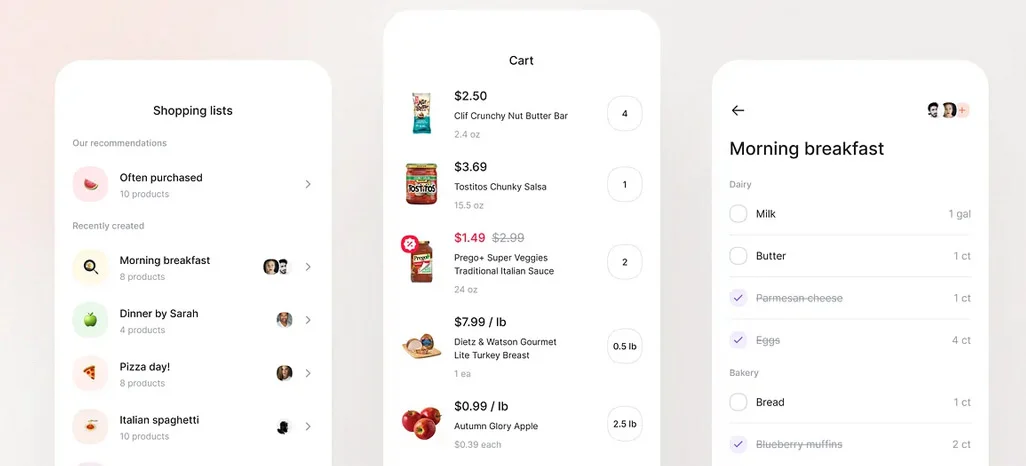
Comparing grocery prices across multiple quick commerce platforms can reveal whether a price increase is widespread or specific to a particular retailer. This distinction matters because pricing can be influenced by procurement costs, inventory, local demand, promotions, and competitive positioning. Cross-platform records therefore provide stronger context for interpreting changing food prices.
Using a Real-Time Grocery Price Tracking API within a recurring collection process can help organize observations by product, retailer, location, and timestamp. Analysts can then compare equivalent products across different platforms and identify common movements. Repeated observations also make it easier to detect pricing gaps that may otherwise appear as isolated changes.
A Grocery Price Comparison API for Inflation Research can support deeper evaluation by separating market-wide movements from retailer-specific decisions. For example, if the same packaged product increases across several platforms, the movement may indicate broader market pressure. If only one retailer changes its price, other factors may require closer examination.
Cross-market analysis can examine:
- Retailer-to-retailer price differences
- City-level pricing variation
- Brand and private-label movement
- Weekly and monthly changes
- Category-level fluctuations
- Unusual pricing outliers
| Comparison Area | Possible Insight |
|---|---|
| Retailer comparison | Competitive movement |
| Geographic comparison | Regional variation |
| Brand comparison | Brand-level pricing behavior |
| Time comparison | Short-term changes |
| Category comparison | Concentrated pressure |
FAO's food price monitoring resources emphasize frequent domestic price information as an early-warning mechanism for unusual food-price dynamics. Combining these broader indicators with granular digital retail observations can provide a more detailed understanding of changing food costs.
How Retail Scrape Can Help You?
We can help businesses collect and organize grocery pricing information from digital retail environments across products, retailers, locations, and time periods. By creating structured datasets, our approach supports Grocery Price Tracking while maintaining consistent product identifiers, pricing records, timestamps, and location-level information for recurring analysis.
Our workflow can support businesses through:
- Identifying relevant grocery categories and products
- Collecting pricing information from selected digital retailers
- Structuring product, brand, quantity, and location information
- Recording recurring changes across defined periods
- Organizing historical observations for trend analysis
- Preparing datasets for dashboards, reports, and analytical models
This can be useful for retailers, pricing teams, researchers, analysts, and businesses that require regularly refreshed grocery information for market evaluation and reporting. A Grocery Data API can help connect collected information with recurring business workflows, allowing teams to process structured records more efficiently.
We can also organize pricing records according to specific business requirements, including selected products, geographic markets, retailers, collection frequencies, and historical periods. Grocery Price Data API for Retail Intelligence can support broader retail analysis by connecting detailed pricing observations with competitive and market-level intelligence.
Conclusion
Digital grocery platforms create frequent pricing signals that can provide a detailed view of changing food costs. Grocery Price Tracking helps businesses examine product-level movements, regional differences, category-specific pressure, and retailer variations. When these observations are collected consistently, they can complement broader inflation indicators and provide useful context for understanding everyday consumer pricing.
Structured datasets can also support recurring market assessments and pricing decisions. Grocery Price Inflation Tracking provides a practical foundation for evaluating repeated movements and identifying areas where inflationary pressure is concentrated. Connect with Retail Scrape to build structured grocery pricing datasets for smarter inflation and retail analysis.