
How to Track Property Price Trends With Python to Understand Housing Markets Across US Cities?
Introduction
Housing markets across the United States change continuously as property prices, mortgage conditions, inventory, and buyer demand shift. Real estate teams increasingly Track Property Price Trends With Python to organize large datasets, compare cities, identify recurring patterns, and evaluate local market movements with greater consistency.
Python makes it easier to collect, clean, analyze, and visualize property information from multiple sources. A Python Property Price Tracker can process historical prices, listing details, neighborhood information, and market indicators to create structured datasets for deeper research and reporting.
With automated workflows, analysts can monitor hundreds or thousands of property records across multiple locations instead of reviewing listings manually. This approach supports US Real Estate Price Tracker Python workflows, helping teams compare markets, identify unusual movements, and build repeatable analysis processes for changing housing conditions.
Strategic Foundations for Comparing Housing Prices Across Major US Cities
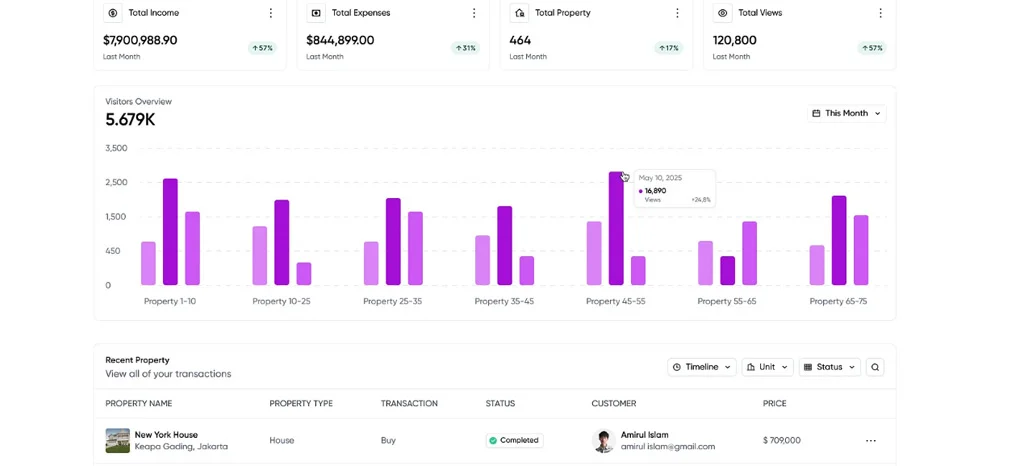
Comparing housing markets requires consistent records covering property values, locations, property categories, and collection periods. Analysts can organize information from multiple cities and apply the same calculations to each dataset. This creates a stronger foundation for Us City Property Price Comparison, particularly when market differences need to be evaluated using standardized measurements rather than isolated listing observations.
Python-based processing can calculate median prices, average values, price-per-square-foot figures, and percentage changes across selected locations. These measurements help analysts identify areas with stronger appreciation or slower movement. Property Price Trend Analysis Python workflows can also segment results by property type, neighborhood, and reporting period to provide more detailed market comparisons.
Historical datasets become especially useful when analysts compare several months or years instead of relying on current listings alone. Tracking repeated observations can reveal seasonal movements, long-term appreciation, and periods of unusual volatility. It also helps researchers distinguish short-term fluctuations from broader changes affecting local housing markets.
Key comparison activities include:
- Standardizing property records across locations
- Comparing median and average property prices
- Measuring month-over-month price movements
- Grouping properties by category and neighborhood
- Identifying markets with significant price variation
| Metric | Typical Measurement | Analytical Purpose |
|---|---|---|
| Median Price | USD | Market benchmarking |
| Average Price | USD | Overall valuation |
| Price Per Square Foot | USD | Property comparison |
| Monthly Change | Percentage | Short-term movement |
| Annual Change | Percentage | Long-term trend |
Using consistent calculations across cities makes property research more reliable. Analysts can create dashboards, reports, or visualizations that show how individual markets compare while maintaining a repeatable analytical framework for ongoing housing research.
Smarter Frameworks for Organizing Historical Housing Data Across Markets
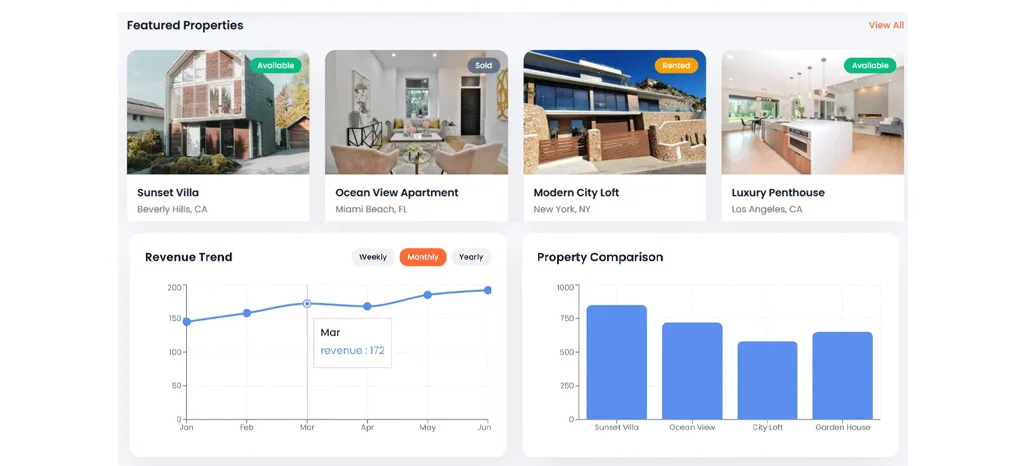
Historical property information provides essential context for understanding how housing markets evolve over time. Instead of examining isolated listings, analysts can combine prices, locations, property types, listing dates, and availability details into structured datasets. Scrape Property API Data workflows can support automated collection where suitable data access is available.
Once collected, records can be cleaned and standardized before analysis. Python scripts can remove duplicate entries, normalize location names, correct inconsistent price formats, and organize timestamps. This creates more dependable datasets for Track Us Home Prices With Python workflows, allowing analysts to compare historical movements using consistent analytical rules.
Longitudinal datasets can reveal patterns that may not be visible through individual listings. For example, analysts can examine whether prices rise consistently during certain periods, whether inventory changes correspond with price movements, or whether particular cities show stronger volatility than others. These observations can improve recurring market reports.
Useful monitoring activities include:
- Collecting property records at regular intervals
- Removing duplicate or incomplete records
- Standardizing locations and property attributes
- Calculating historical price movements
- Maintaining comparable time-series datasets
| Data Category | Example Fields | Monitoring Benefit |
|---|---|---|
| Property | Type, Size | Segment analysis |
| Pricing | Asking Price, Sale Price | Valuation tracking |
| Location | City, Area | Geographic comparison |
| Timing | Listing Date | Historical analysis |
| Availability | Status | Supply monitoring |
A structured historical pipeline also makes recurring analysis more efficient. Teams can refresh datasets periodically and apply the same calculations to new records, creating a consistent foundation for market research, reporting, and housing trend evaluation across multiple US locations.
Actionable Signals From Property Records for Stronger Market Decisions
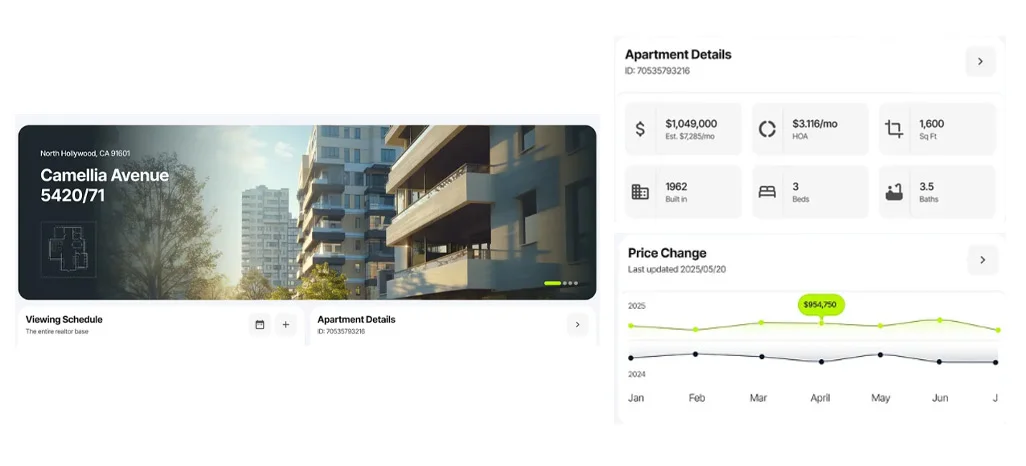
Large property datasets become more useful when raw records are transformed into measurable indicators. Analysts can examine pricing changes, listing activity, property categories, and geographic differences to understand market behavior. A Real Estate Data Scraper can support structured collection workflows that provide organized information for downstream analysis and reporting.
Python can process these records to calculate percentage changes, price distributions, and market-level comparisons. With Real Estate Data Trends Using Python, analysts can identify locations where property values are rising rapidly, remaining stable, or experiencing notable declines. These signals can then support investment research, market reports, and strategic planning.
City-level analysis becomes more informative when several indicators are reviewed together. Analysts can compare price growth with listing volume, property categories, and historical averages to understand whether a market movement represents broader demand or a temporary change. This creates stronger context for interpreting local housing conditions.
Important analytical activities include:
- Measuring price changes between reporting periods
- Identifying cities with unusual market movement
- Comparing property categories across locations
- Monitoring changes in listing activity
- Creating visual reports for decision-makers
| Market Signal | Measurement | Business Relevance |
|---|---|---|
| Price Growth | Percentage | Appreciation assessment |
| Median Value | USD | Market positioning |
| Listing Volume | Count | Supply evaluation |
| Price Distribution | Range | Market segmentation |
| Property Mix | Percentage | Category analysis |
For broader geographic research, Track Property Price Changes Across US Cities can help analysts organize comparisons between local markets. Similarly, City-Level Housing Price Analysis With Python can support deeper examination of individual locations, allowing teams to transform property records into practical signals for research and reporting.
How Retail Scrape Can Help You?
Real estate analysis depends on reliable, structured, and regularly updated property information. We can support data workflows that organize property records from multiple sources into formats suitable for research, reporting, and analytical applications. By combining automated collection with structured processing, teams can Track Property Price Trends With Python and maintain datasets for recurring market evaluation.
Key capabilities can support property research workflows by helping teams:
- Collect property information from multiple online sources
- Structure large volumes of listing records
- Standardize prices, locations, and property attributes
- Organize historical records for trend analysis
- Prepare datasets for dashboards and analytical models
- Support recurring property market monitoring workflows
For businesses conducting Real Estate Data Intelligence, organized property datasets can simplify comparisons between locations, property categories, and time periods. We can help prepare data for Python-based analysis, visualization, reporting, and downstream applications while reducing repetitive manual data preparation.
Conclusion
Python provides a practical approach for organizing property information, calculating price movements, and comparing housing markets across different locations. When businesses Track Property Price Trends With Python, they can transform scattered property records into structured insights for market research, investment analysis, and strategic planning.
Consistent data collection also strengthens Real Estate Price Trends Using Python workflows by supporting historical comparisons and recurring monitoring. Build reliable property datasets with us and turn changing housing-market information into useful analytical insights. Contact Retail Scrape today to discuss your real estate data requirements.