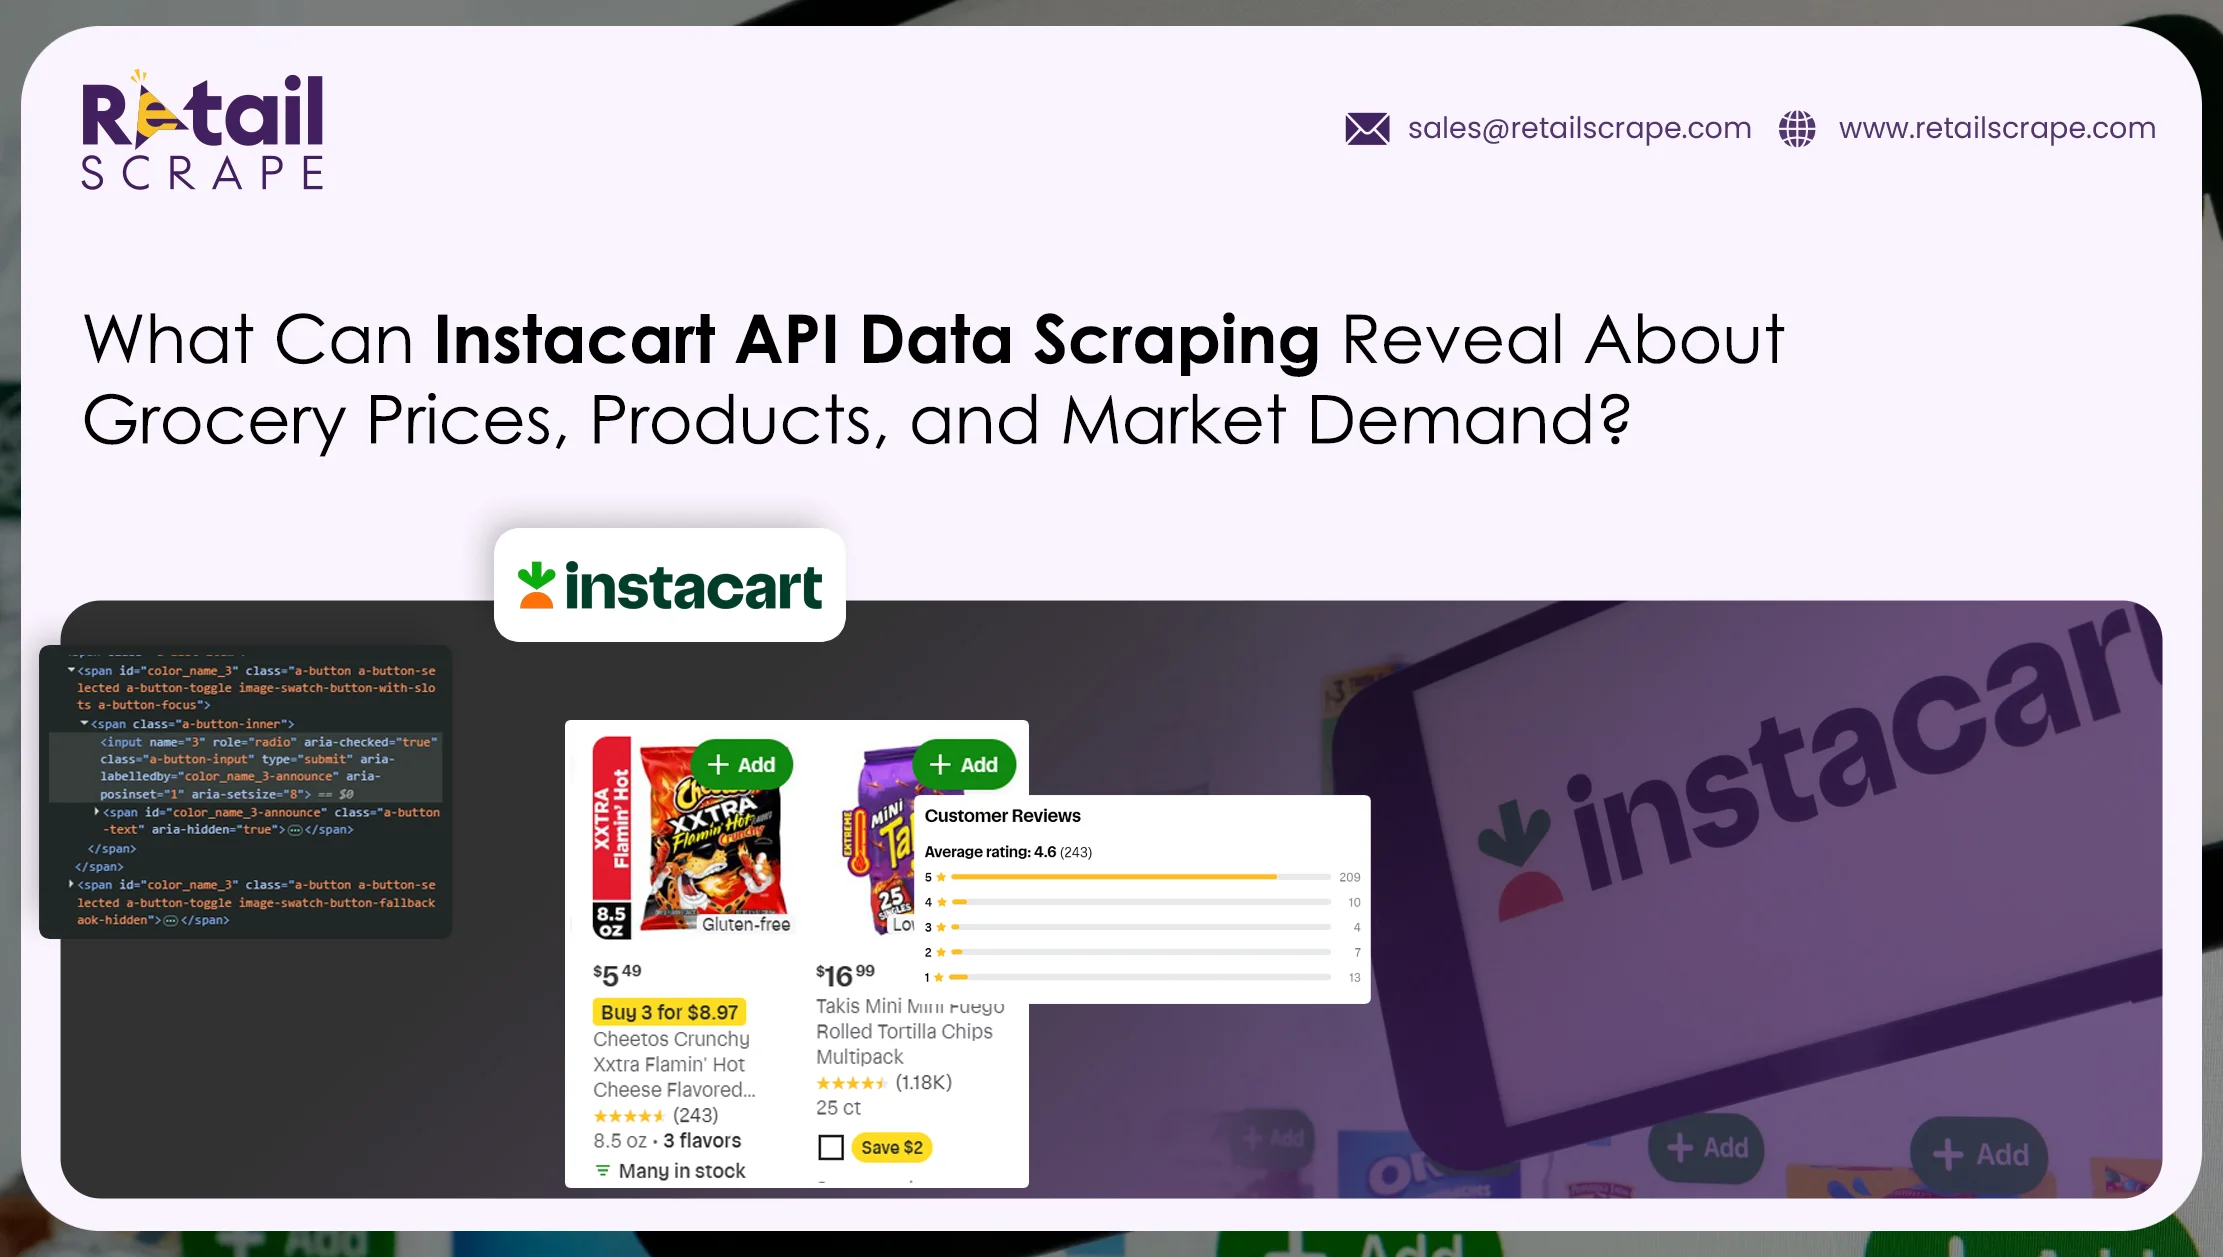
What Can Instacart API Data Scraping Reveal About Grocery Prices, Products, and Market Demand?
Introduction
Grocery businesses need timely visibility into prices, products, inventory, and changing buying patterns to make informed commercial decisions. Instacart API Data Scraping can organize marketplace information into structured datasets covering product listings, pricing, categories, availability, and other attributes required for grocery intelligence.
Price fluctuations can vary by product, location, retailer, package size, promotion, and shopping period. Capturing these changes at regular intervals helps businesses evaluate market movements and understand how pricing conditions evolve. Structured grocery information also supports assortment planning, category analysis, competitor research, and demand-related assessments.
Beyond individual prices, marketplace data can reveal broader patterns across products and categories. Businesses can compare product availability, identify frequently changing items, monitor assortment depth, and examine pricing relationships. When collected consistently, this information can support dashboards, forecasting models, business reports, and analytical workflows for grocery retailers, brands, marketplaces, and research teams.
Grocery Price Movements Reveal Important Market Trends
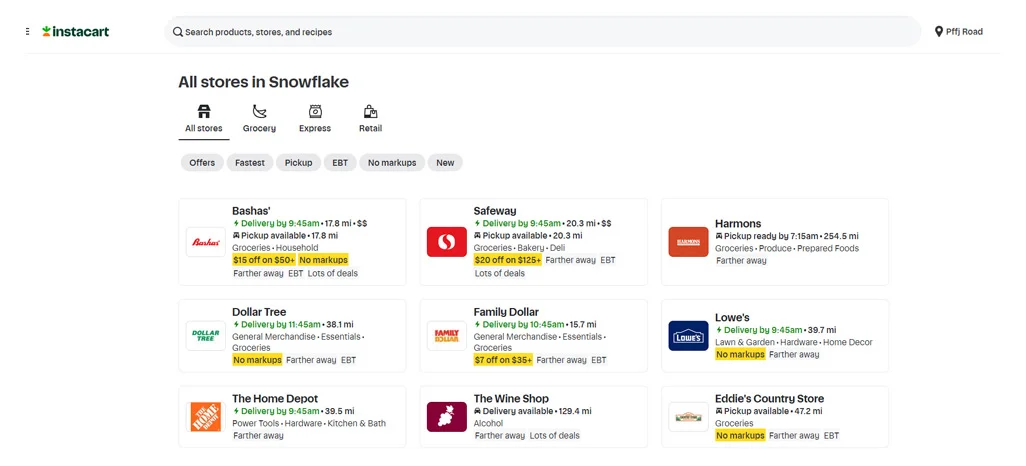
Grocery pricing patterns provide valuable insight into how marketplace conditions change across products, retailers, locations, and shopping periods. Businesses can examine regular prices, promotional adjustments, package-size differences, and category-level fluctuations to understand how pricing behaves over time. Through Instacart Grocery Price Monitoring API, these observations can be organized into recurring datasets for structured monitoring and reporting.
Historical price records become more meaningful when businesses compare multiple collection periods rather than examining isolated values. A structured Instacart Grocery Price Data API workflow can provide organized pricing fields that help analysts examine product-level changes, retailer differences, and location-based variations. These records can also contribute to pricing dashboards and market research models.
| Metric | Example Coverage | Business Relevance |
|---|---|---|
| Products Tracked | 25,000+ | Assortment analysis |
| Monthly Price Changes | 8,500+ | Pricing research |
| Categories Covered | 120+ | Category benchmarking |
| Locations Monitored | 50+ | Regional analysis |
Pricing information can become even more useful when connected with product attributes and historical records. Businesses can identify frequently changing products, recurring promotional periods, and categories experiencing greater price movement. These patterns can support pricing reviews while providing a broader view of marketplace behavior.
Key applications include:
- Monitoring recurring product-level price changes
- Comparing pricing patterns across selected locations
- Identifying promotional and seasonal movements
- Supporting category-level pricing research
- Building historical pricing dashboards
- Reviewing package-size and product variations
By structuring these observations for analytical workflows, businesses can create a consistent foundation for grocery market assessment. Instacart Grocery Data API Integration for Analytics can further connect collected information with reporting environments, dashboards, or analytical systems used by pricing and commercial teams.
Product Availability Patterns Explain Grocery Supply Changes
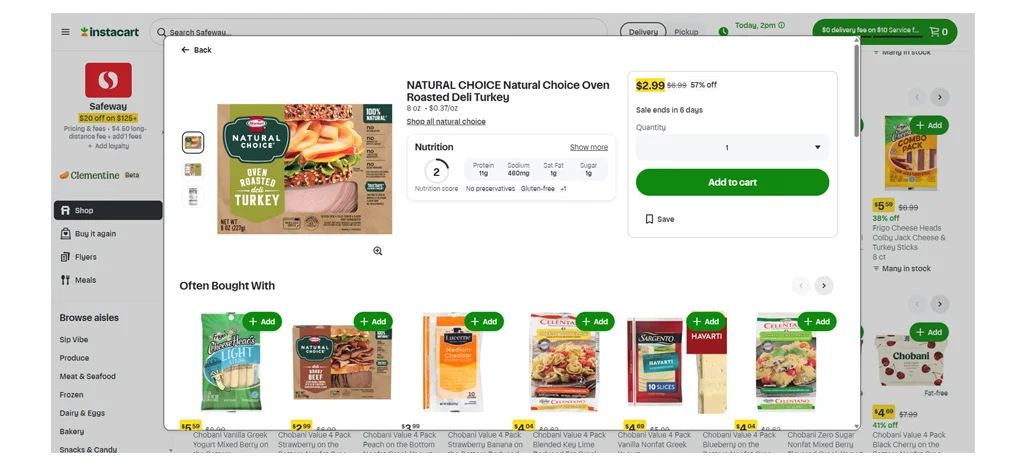
Product availability provides another important perspective on grocery marketplace behavior because product listings can change across retailers, locations, categories, and shopping periods. Businesses can examine whether particular products remain available, become unavailable, or appear differently across locations. Instacart Product Availability Monitoring Data can organize these changes into structured records for recurring supply and assortment analysis.
Availability records can reveal more than simple stock status. When paired with product names, brands, categories, sizes, and locations, they can help analysts identify assortment gaps and recurring availability differences. Instacart Product Catalog Data API can complement these observations by providing structured catalog attributes that make product-level comparisons easier across large datasets.
| Availability Metric | Example Coverage | Analytical Value |
|---|---|---|
| Product Listings | 40,000+ | Catalog visibility |
| Weekly Availability Checks | 15,000+ | Supply monitoring |
| Stores Covered | 100+ | Regional comparison |
| Categories | 150+ | Assortment analysis |
Consistent availability tracking can also help businesses identify patterns associated with seasonal demand, promotional periods, assortment changes, and regional supply conditions. Instead of reviewing individual product pages manually, analysts can work with structured historical observations to identify recurring changes and unusual availability patterns.
Useful applications include:
- Tracking product availability across locations
- Identifying recurring assortment gaps
- Reviewing category-level availability changes
- Comparing product presence across retailers
- Supporting inventory-related research
- Building historical availability reports
When product and availability records are connected, businesses can create a broader understanding of marketplace assortment. Instacart Grocery Inventory Data can provide an additional analytical layer for evaluating product presence and inventory-related patterns across selected grocery categories and locations.
Product Comparisons Clarify Competitive Grocery Positioning
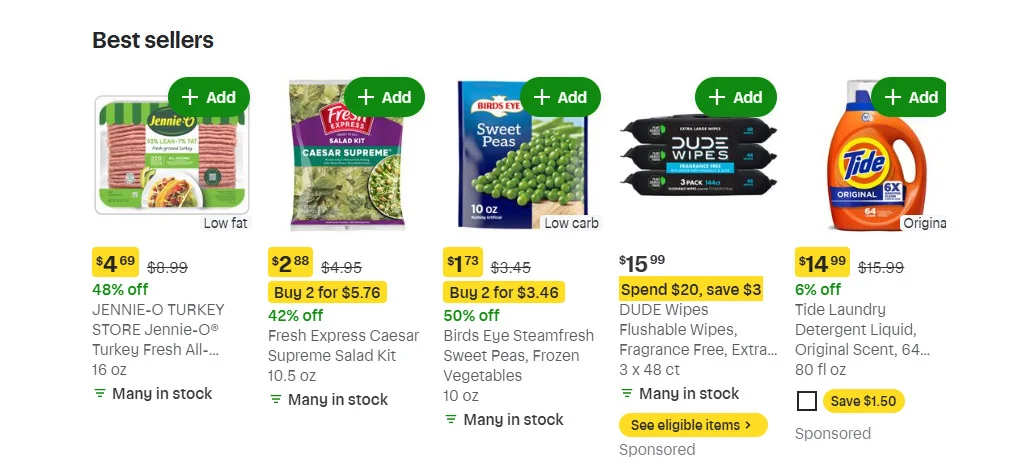
Product comparison provides a practical way to understand how similar grocery items are positioned across sellers, brands, categories, and package sizes. Businesses can compare products using standardized attributes and historical records to identify pricing differences, assortment overlaps, and positioning patterns. Instacart Grocery Price Comparison Data can organize these observations into structured datasets suitable for recurring benchmarking.
Product-level comparison becomes more informative when matching considers attributes such as brand, product name, package size, category, and other available identifiers. Instacart Grocery Data for Market Intelligence can support this broader analytical approach by combining product and marketplace observations for research, benchmarking, and category assessment.
| Comparison Area | Example Coverage | Business Application |
|---|---|---|
| Comparable Products | 18,000+ | Product benchmarking |
| Brands Covered | 2,500+ | Brand analysis |
| Price Records | 60,000+ | Market comparison |
| Package Sizes | 7,500+ | Value assessment |
Historical comparisons can also reveal whether pricing gaps remain consistent or change over time. Businesses may examine recurring differences between similar products, identify frequently changing categories, and review how product positioning varies across locations. These observations can support competitive research without relying on isolated marketplace snapshots.
Key analytical uses include:
- Comparing similar products across sellers
- Reviewing brand-level positioning patterns
- Evaluating package-size differences
- Identifying recurring pricing gaps
- Supporting category benchmarking
- Building competitive research dashboards
Structured comparison datasets can connect product attributes with pricing observations, making large grocery datasets easier to analyze. This approach supports businesses that need consistent product benchmarking across selected categories, locations, brands, and retailers while maintaining historical records for future research and reporting.
How Retail Scrape Can Help You?
We can support Instacart API Data Scraping projects by converting grocery marketplace information into structured datasets designed for business analysis. Data collection workflows can be configured around selected products, categories, locations, retailers, and tracking frequencies based on project requirements.
Key capabilities include:
- Product and category data collection across selected grocery segments
- Recurring capture of pricing and promotional information
- Monitoring of product availability across defined locations
- Structured datasets prepared for analytical workflows
- Historical records that support trend and comparison analysis
- Flexible delivery formats for dashboards, databases, and reporting systems
With Instacart Competitor Price Tracking, businesses can organize competitive observations around products, brands, package sizes, and locations. We can also help integrate collected information into recurring analytical processes, making datasets easier to review and apply across pricing, assortment, market research, and planning activities.
Conclusion
When collected consistently, these datasets can help businesses examine price movements, assortment differences, supply patterns, and market signals across selected locations and product groups. Instacart API Data Scraping can provide structured visibility into grocery prices, products, availability, categories, and changing marketplace conditions.
For broader analytical workflows, Instacart Grocery Data for Market Intelligence can support category research, pricing analysis, product benchmarking, and demand-related assessments. Retailers, brands, marketplaces, and research teams can use structured grocery datasets to build recurring reports and data-driven monitoring processes. Contact Retail Scrape to build a customized grocery data collection solution for your business.