
How Can Swiggy vs Zomato Restaurant Pricing Comparison Explain Menu and Offer Gaps Across Cities?
Introduction
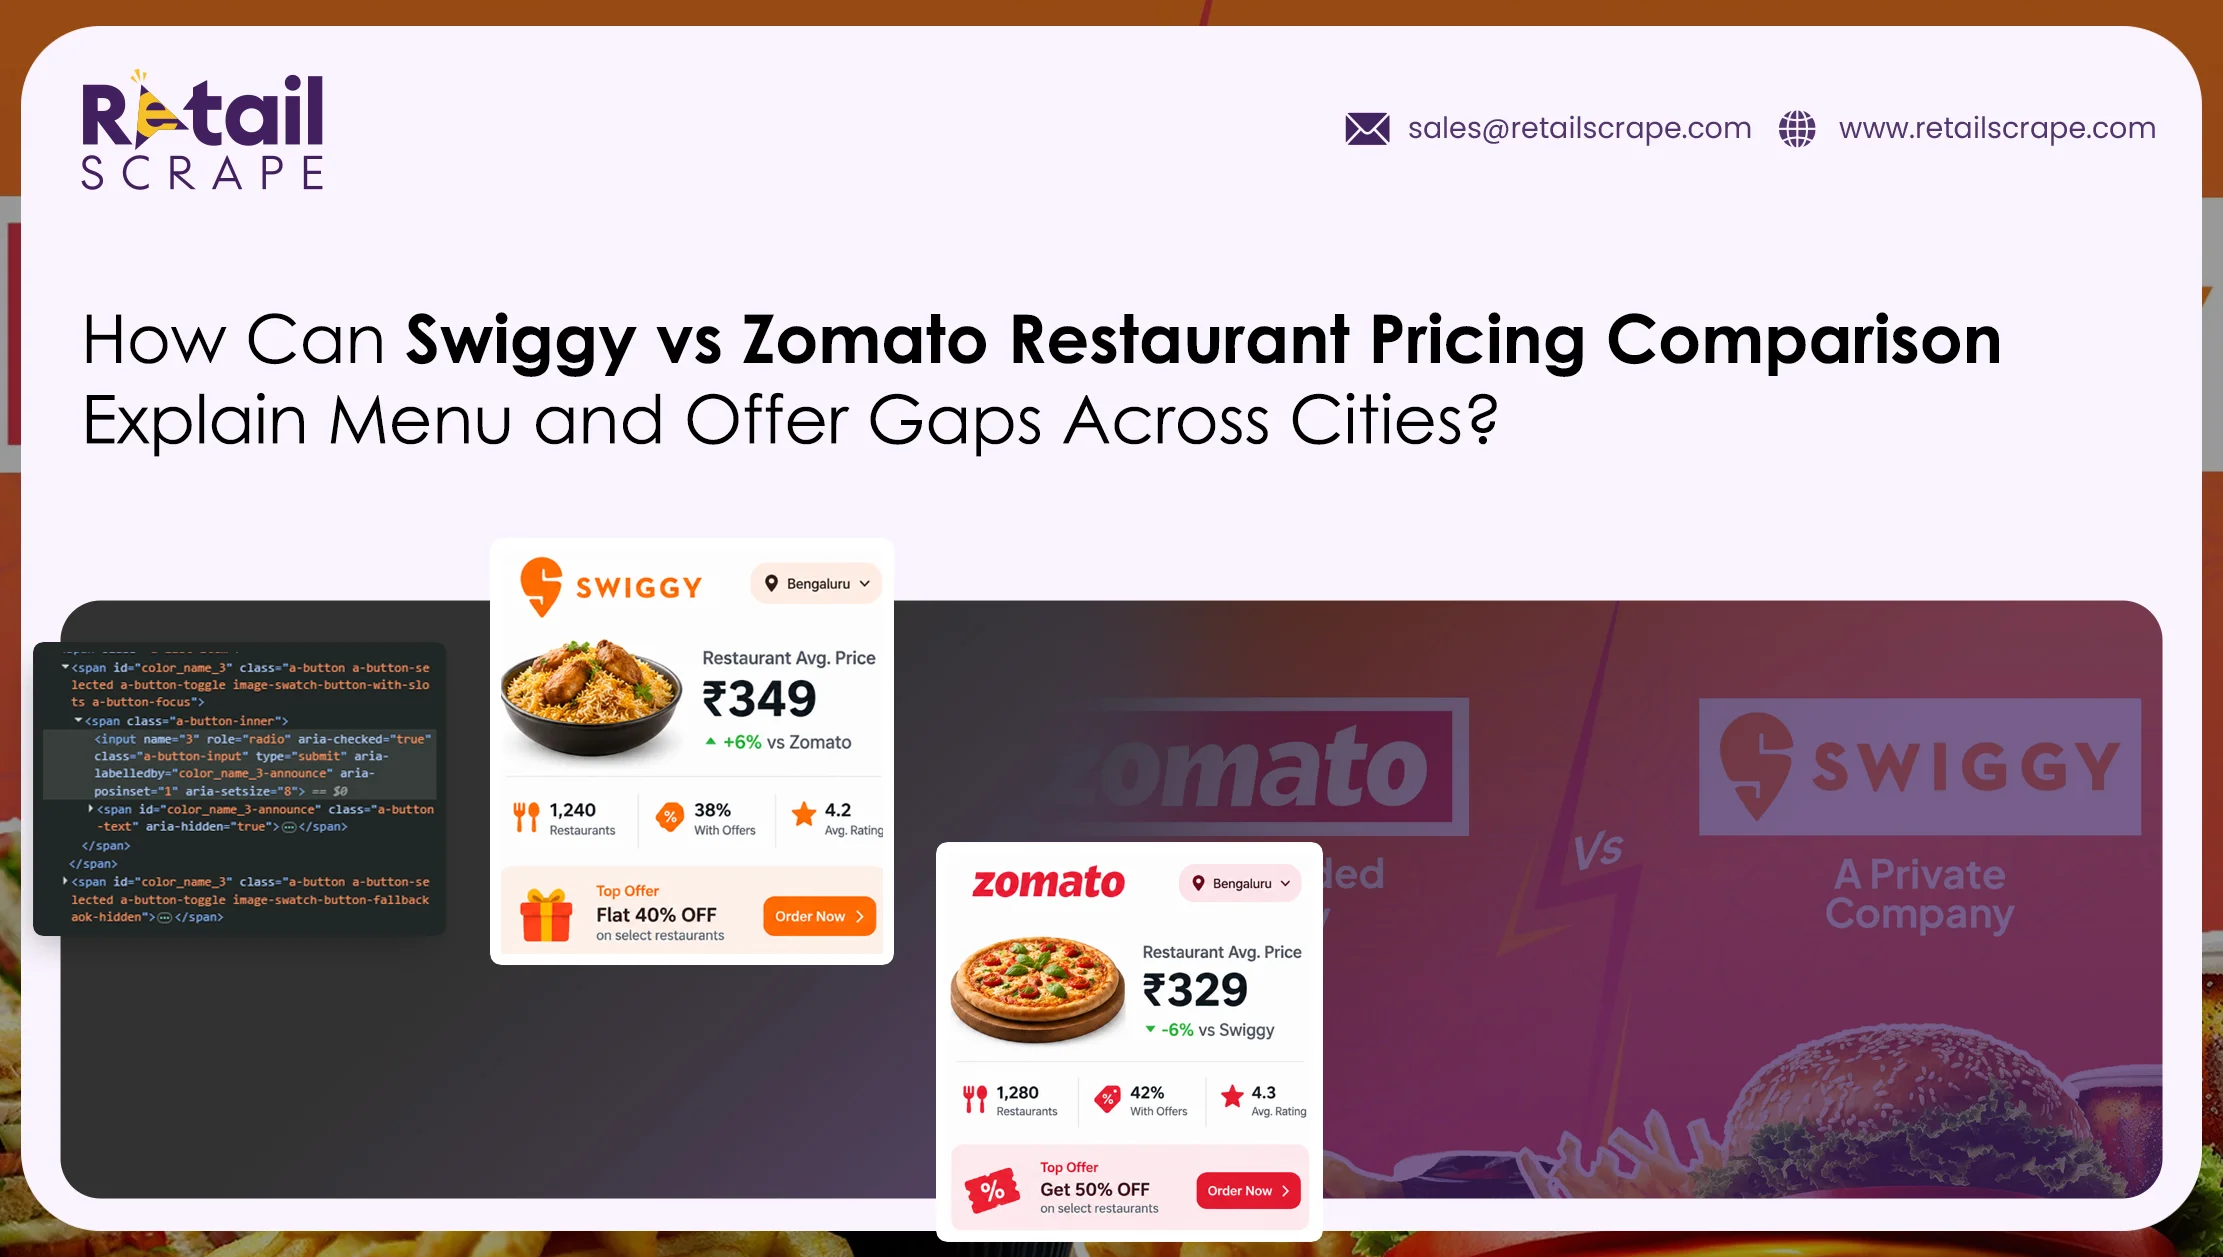
Food delivery platforms have transformed urban dining habits across India, making convenience just a few taps away. However, consumers frequently notice noticeable price disparities when ordering the exact same item from the same restaurant on different apps. A comprehensive Swiggy vs Zomato Restaurant Pricing Comparison highlights how dynamic pricing strategies, platform commissions, and localized promotions create distinct cost gaps.
Behind these variations lie subtle algorithms designed to optimize revenue based on customer demographics and demand density. While one platform might offer flat discounts on popular items, the other might pad item base prices or impose higher packaging charges. Implementing Zomato Price Monitoring allows industry analysts to uncover these subtle variations, revealing how platforms adapt their pricing structures based on real-time market signals.
Understanding these pricing mechanisms is crucial for both budget-conscious consumers and competitive restaurant operators. By systematically analyzing menu pricing across cities, stakeholders can identify hidden markups and discount patterns. This detailed exploration breaks down regional pricing gaps, menu inflations, and platform-specific deals to help you make smarter ordering decisions.
City Wise Food Delivery App Pricing Strategy Differences
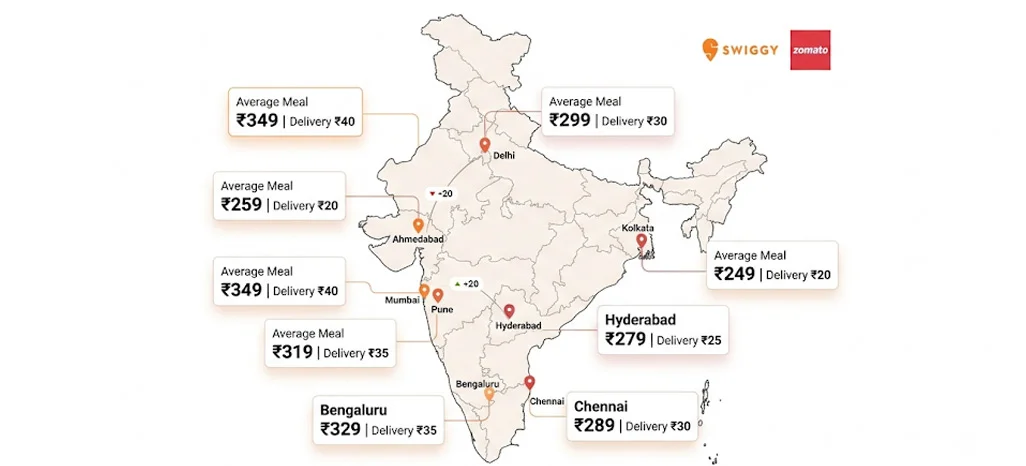
Food delivery applications implement distinct dynamic pricing strategies based on regional customer demographics, local operational expenses, and market demand density across different metropolitan areas. When analyzing daily orders, consumers often notice that the exact same meal incurs varying total bill amounts depending on their geographic location. A thorough Restaurant Price Comparison by City reveals how platform commissions and surge charges fluctuate significantly between major metropolitan hubs and secondary urban markets across the country.
Regional market conditions dictate how aggressively platforms adjust their baseline fees, impacting both casual diners and multi-location food brand operations. High-density commercial zones frequently experience unique pricing surges, whereas residential suburbs display entirely different cost trends during peak dining hours. Utilizing continuous City-Wise Restaurant Pricing Intelligence enables industry stakeholders to map these geographic patterns accurately and evaluate localized customer purchasing power without making hasty assumptions.
To highlight these geographic price variations clearly, the structured matrix below presents average platform markups, delivery fee spreads, and localized bill variations across key metropolitan zones:
| Geographic Location Zone | Platform A Markup Ratio | Platform B Markup Ratio | Average Bill Difference |
|---|---|---|---|
| Zone 1 Metros | High (+18%) | Moderate (+15%) | Significant |
| Zone 2 Metros | Very High (+22%) | High (+20%) | Moderate |
| Capital Regions | Moderate (+16%) | High (+19%) | Moderate |
| Southern Hubs | Standard (+14%) | Standard (+12%) | Minimal |
- Metropolitan areas exhibit higher base fee inflations compared to smaller urban zones.
- Surge pricing algorithms react differently based on local traffic density and weather changes.
- Distance-based delivery charges create substantial cart value gaps between competing platforms.
- Localized restaurant competition heavily influences the depth of app-specific customer discounts.
Evaluating location-based fee variations helps both consumers and restaurant operators understand why food delivery totals diverge so drastically across urban regions. Delivery distances, local rider availability, and municipal taxes all play interconnected roles in determining the final checkout amount displayed on smartphone screens. Recognizing these distinct regional factors ensures better decision-making when selecting an ordering platform for specific neighborhood destinations.
Menu Inflations And Hidden Order Charges Decoded Fully
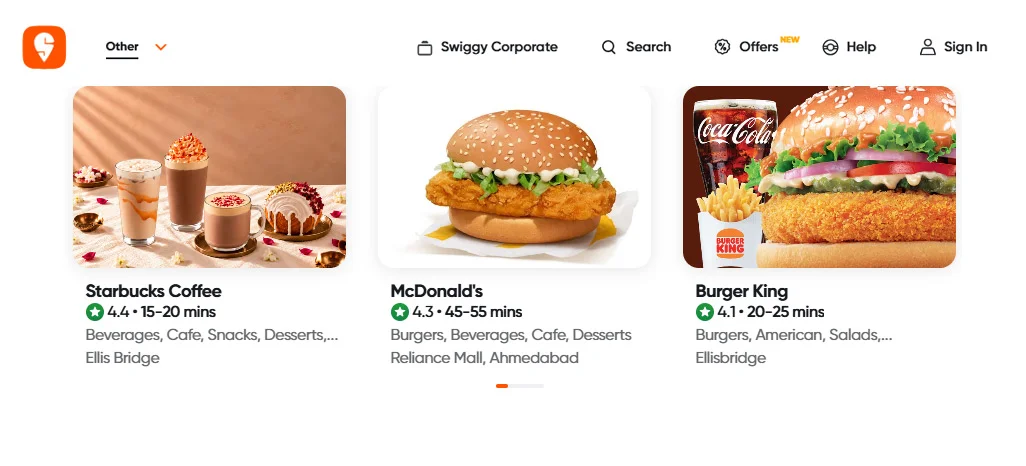
The total expense of an online food order extends far beyond the initial listing displayed on digital storefronts. App platforms frequently integrate multiple secondary fee layers, including packaging fees, platform handling costs, small order surcharges, and peak-hour delivery rates. Conducting targeted Swiggy Menu Price Data Scraping allows market analysts to isolate core dish inflation from external service charges, uncovering exactly where additional costs accumulate before checkout.
In many scenarios, partner outlets modify their digital menu pricing independently across competing apps to offset variable merchant commission rates. For instance, a dish listed at standard dine-in rates might receive a higher markup on one app while incurring steep packaging charges on another. Implementing systematic Swiggy Price Tracking provides complete visibility into these granular pricing shifts, helping analysts separate base product markups from additional convenience fees.
The comprehensive overview below outlines standard fee components, structural platform ranges, and their ultimate impact on final consumer bill totals:
| Order Cost Breakdown | App Structure Alpha | App Structure Beta | Total Bill Weight |
|---|---|---|---|
| Base Item Inflation | Standard Range | Standard Range | Primary Factor |
| Packaging Surcharge | Fixed Rate | Variable Rate | Secondary Factor |
| Platform Handling Fee | Flat Tier | Tiered System | Minor Factor |
| Peak Demand Surge | Dynamic Rate | Dynamic Rate | Variable Factor |
- Base dish rates on digital apps often exceed offline dine-in menu pricing.
- Packaging charges vary significantly between independent outlets and major franchise chains.
- Platform convenience fees are consistently updated during high-volume meal windows.
- Unplanned surcharges heavily influence final cart totals during inclement weather conditions.
Understanding these underlying fee structures empowers users to identify hidden order costs before completing their digital transactions. While base prices may appear identical initially, backend calculations involving taxes and platform fees can create surprising bill differences. Tracking these subtle variations over time ensures a clear view of true service costs across diverse dining categories.
Platform Promotional Discount Gaps And Savings Analysis
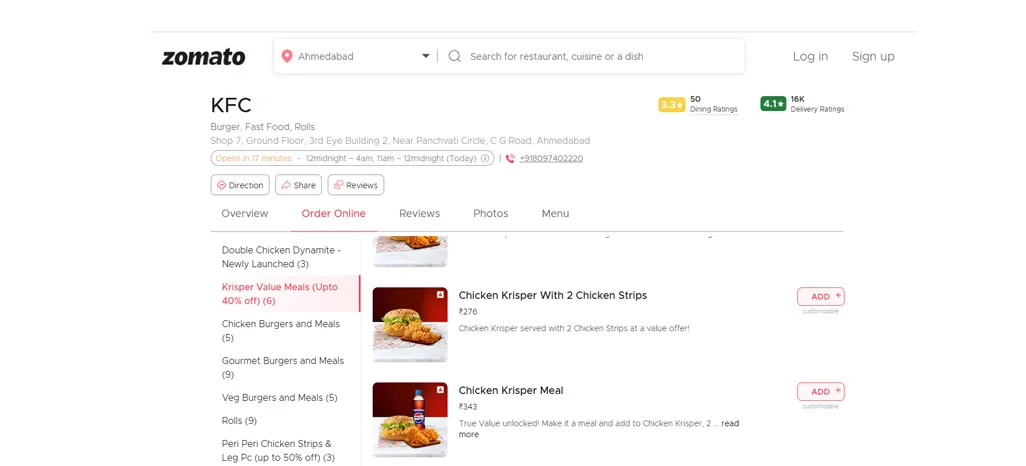
Promotions and loyalty subscriptions represent the main avenue for customer acquisition and retention across competitive delivery platforms. Promotional claims can often obscure real pricing differences, making cart totals look cheaper than they truly are. By utilizing Zomato Food Data Scraping, researchers can evaluate real discount value by comparing checkout amounts rather than relying on headline percentages.
A detailed Swiggy vs Zomato Offers Comparison reveals distinct promo strategies across competing platforms. One app might focus on instant bank payment discounts, while another prioritizes flat cart reductions or subscription-based free delivery. Furthermore, running a comprehensive Swiggy vs Zomato Food Offers and Discounts Analysis helps clarify how minimum spend thresholds and maximum discount caps affect actual out-of-pocket savings for daily consumers.
The clear comparative breakdown below summarizes standard promotional structures, loyalty incentives, and net savings across common ordering scenarios:
| Incentive Structure | Platform Model One | Platform Model Two | Primary Savings Advantage |
|---|---|---|---|
| Payment Partner Savings | Up to Set Limit | Higher Cap Limit | Model Two |
| Membership Benefits | Low Spend Threshold | High Spend Threshold | Model One |
| Direct Outlet Coupon | Higher Maximum Cap | Lower Maximum Cap | Model One |
| Pickup Special Offers | Standard Discount | Enhanced Discount | Model Two |
- Instant bank discounts depend heavily on specific payment card partnerships and minimum carts.
- Subscription programs offer maximum value to frequent users ordering above set threshold amounts.
- Direct restaurant coupons frequently carry maximum discount limits that cap higher-value cart savings.
- Special pickup promotions yield distinct pricing structures compared to standard doorstep delivery orders.
Evaluating discount strategies requires looking past eye-catching banner offers to analyze real checkout pricing. Coupon conditions, payment method rules, and membership benefits combined alter final cart totals in unexpected ways. Comparing promotional models across diverse order sizes helps pinpoint which options deliver genuine cost benefits.
How Retail Scrape Can Help You?
Navigating complex delivery app structures requires precision data collection at scale. Performing a detailed Swiggy vs Zomato Restaurant Pricing Comparison helps businesses gain transparent insights into competitor pricing and city-wide menu trends.
We provide robust data extraction services tailored for restaurant chains, aggregators, and market researchers who need continuous visibility into online delivery channels.
- Extract real-time menu prices, item descriptions, and addon costs across multiple food delivery apps seamlessly.
- Monitor platform-specific packaging charges, delivery fees, and dynamic surge pricing across major metropolitan regions.
- Track competitor discount structures, bank offers, and promotional campaigns to optimize your own pricing strategies.
- Identify city-specific pricing trends and demand variations to refine localized marketing and distribution plans.
- Receive structured, clean datasets formatted for instant integration into enterprise analytics dashboards and reporting tools.
- Automate daily data extraction schedules to capture fast-moving menu adjustments and limited-time promotional deals.
By equipping your team with reliable data feeds, you can perform comprehensive Swiggy Zomato Restaurant Price Analysis to make informed, data-driven decisions that protect margins and increase market share across all operational regions.
Conclusion
Understanding online food ordering costs requires looking past flashy promotional banners to evaluate full cart totals. Executing a comprehensive Swiggy vs Zomato Restaurant Pricing Comparison reveals that menu markups, platform fees, and promotional structures vary significantly across different cities and dining categories.
Analyzing localized app data provides the clarity needed to navigate fluctuating delivery charges and hidden menu inflation. Leveraging continuous Restaurant Menu Price Comparison India insights ensures you always secure maximum value on every transaction while staying competitive in a rapidly evolving market. Contact Retail Scrape and start optimizing your digital food delivery strategy and maximize your daily savings today.