
What Does Blinkit MRP vs Selling Price Data Show About Real Product Prices on Quick Commerce Sites?
Introduction
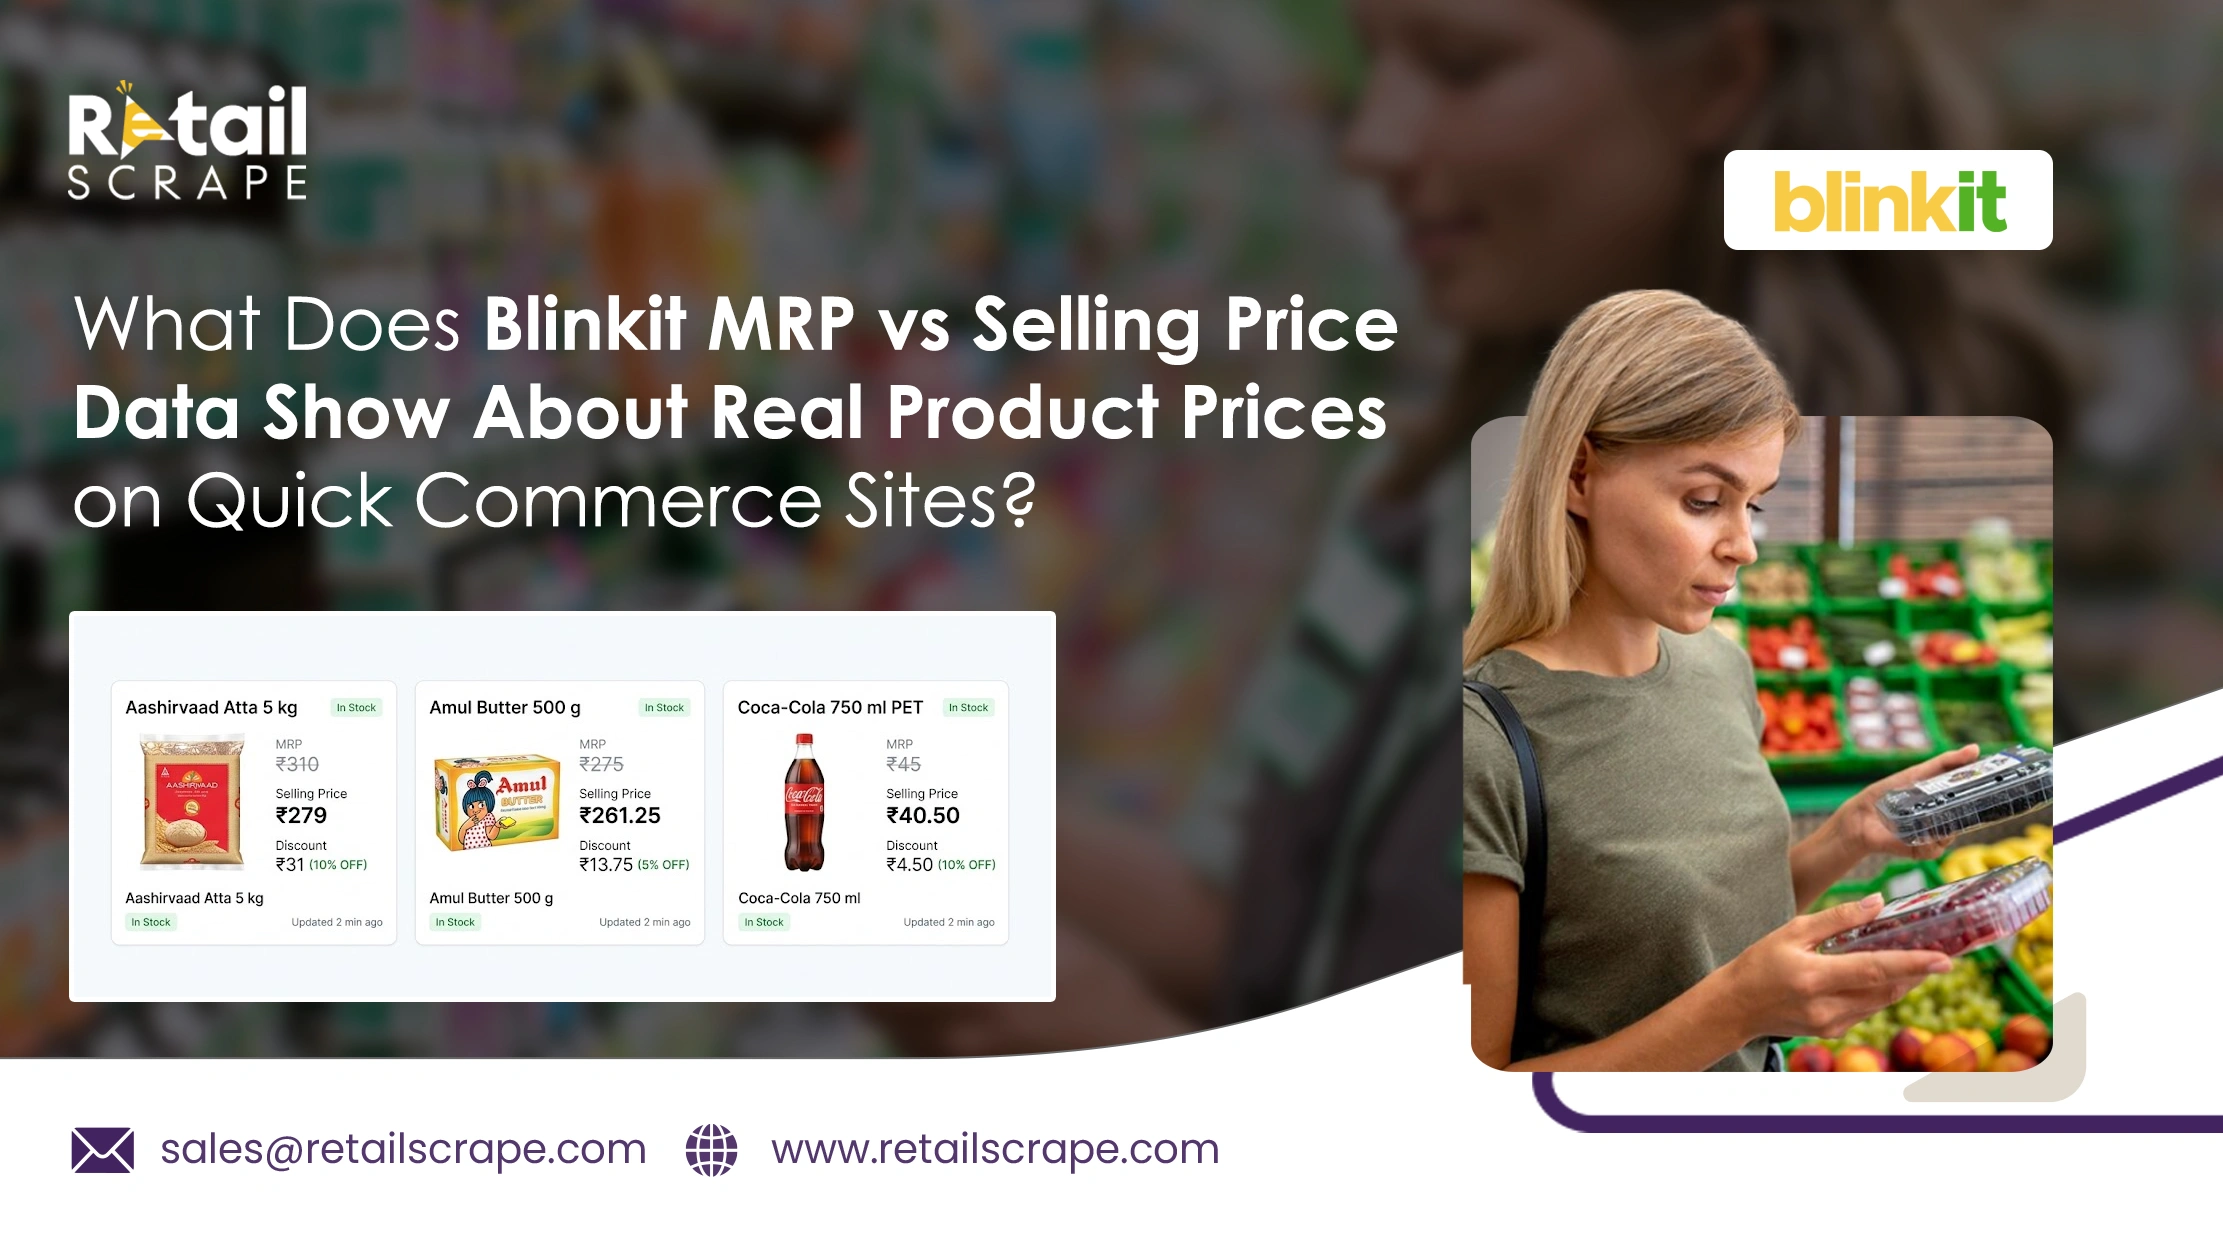
Grocery prices on quick commerce platforms can change frequently because of promotions, demand, location, inventory, and seller strategies. Blinkit MRP vs Selling Price Data helps businesses examine differences between printed maximum retail prices and actual selling prices, creating a clearer view of everyday product pricing.
These differences can reveal whether discounts are consistent, temporary, category-specific, or influenced by changing market conditions. Businesses using Blinkit Price Comparison can evaluate product-level variations, identify recurring pricing patterns, and understand how customers may encounter different prices for similar grocery products across locations and collection periods.
For retailers, analysts, and researchers, structured pricing information provides a practical foundation for monitoring market movements. Comparing MRP with selling prices can highlight discount ranges, pricing anomalies, and competitive positioning while supporting more reliable analysis of quick commerce pricing behavior.
Examining MRP Gaps Across Everyday Blinkit Grocery Products
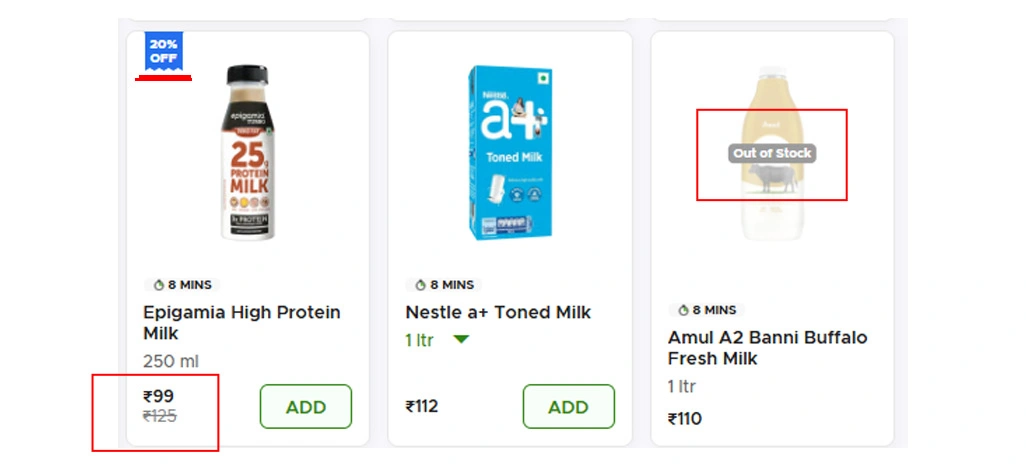
MRP and selling-price comparisons provide a straightforward way to understand how listed grocery prices differ from actual prices displayed to customers. The difference can indicate whether products are regularly discounted, temporarily promoted, or sold close to their printed MRP. Blinkit MRP Price Scraping can collect product names, MRP, selling prices, discount percentages, categories, and availability in a structured format.
When these fields are gathered consistently, businesses can calculate price gaps at product and category levels rather than depending on occasional manual observations. This creates a more dependable dataset for evaluating everyday pricing behavior across a large assortment. Historical collection adds another layer to this analysis because prices observed on one day may not represent longer-term behavior.
Such variations can become meaningful when measured across thousands of products. Blinkit Price Tracking can support these recurring observations by organizing price records across different dates and collection periods. For example, a product listed at ₹180 MRP and ₹155 selling price has a ₹25 difference, while another product with the same MRP may show only a ₹10 reduction.
| Pricing Metric | Illustrative Value |
|---|---|
| Products analyzed | 10,000 |
| Average MRP | ₹185 |
| Average selling price | ₹161 |
| Average price difference | ₹24 |
| Discounted products | 62% |
Businesses can also segment the collected information by grocery category, brand, product size, or availability status. This makes it easier to identify categories where price reductions appear frequently and products where the selling price remains comparatively stable. They can also provide a clearer basis for reviewing customer-facing price changes without relying solely on promotional labels.
Key analytical activities include:
- Compare MRP and selling prices at product level
- Measure discount frequency across grocery categories
- Identify unusually large or small price differences
- Maintain historical records for recurring analysis
A practical dataset can support several analytical activities while keeping pricing information organized for future comparisons. Teams can examine average price gaps, identify products with unusual differences, and compare the frequency of discounted listings across categories. These observations may help retailers evaluate market positioning and researchers understand how quick commerce pricing behaves over time.
Tracking Historical Price Movements Behind Listed Discounts
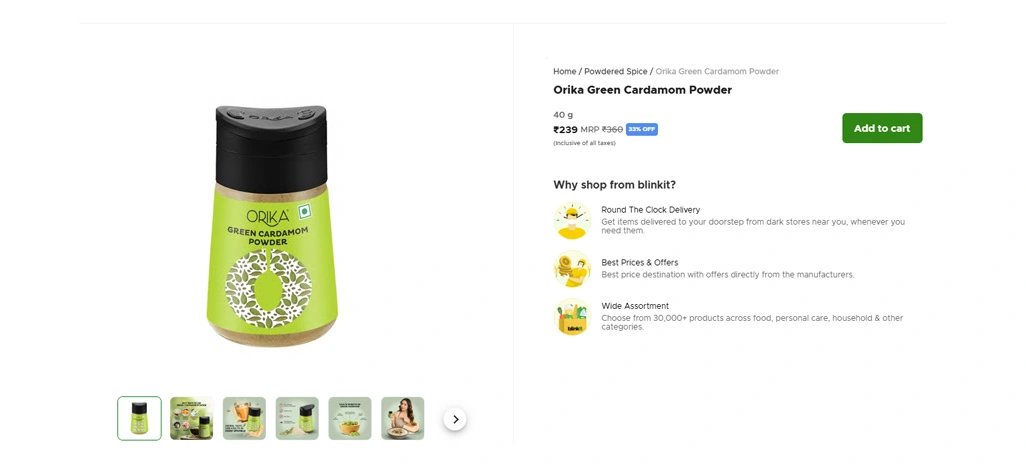
Historical pricing records can show whether observed discounts remain consistent or change with demand, promotions, inventory, and market conditions. A single price observation provides limited context, whereas repeated collection creates a timeline that analysts can use to measure movement. Blinkit Product Price Scraping can capture structured information such as product names, listed prices, MRP, discount values, categories, and availability at scheduled intervals.
These records can then be compared across days or weeks to identify products experiencing frequent changes and products maintaining relatively stable prices. Such historical visibility is particularly useful when evaluating promotional pricing. Snacks, beverages, personal care items, and household products may experience different promotional cycles, making category-level analysis important.
This approach provides more context than simply recording the lowest available price. Blinkit Pricing Intelligence can help organize collected pricing records into analytical views that highlight average discounts, price-change frequency, and category movements. For instance, analysts could compare the average selling price of the same product across multiple collection dates and determine whether reductions are temporary or sustained.
| Historical Indicator | Illustrative Result |
|---|---|
| Collection period | 30 days |
| Products analyzed | 5,000 |
| Average discount | 11% |
| Products with frequent changes | 18% |
| Relatively stable products | 54% |
Another useful approach involves identifying products that repeatedly move between different price levels. A product may initially appear with a modest discount, experience a deeper reduction during a promotional period, and later return closer to its MRP. Recording these movements allows analysts to distinguish normal price fluctuations from significant changes.
Practical historical tracking activities include:
- Record product prices at scheduled intervals
- Compare current and historical selling prices
- Segment movements by category and product
- Identify recurring promotional price patterns
Structured historical data supports reporting and visualization across multiple dimensions. Businesses can review daily changes, compare category averages, and identify products requiring closer observation. Instead of treating each price change as an isolated event, analysts can place it within a longer pricing timeline.
Comparing Discount Behavior Across Quick Commerce Categories
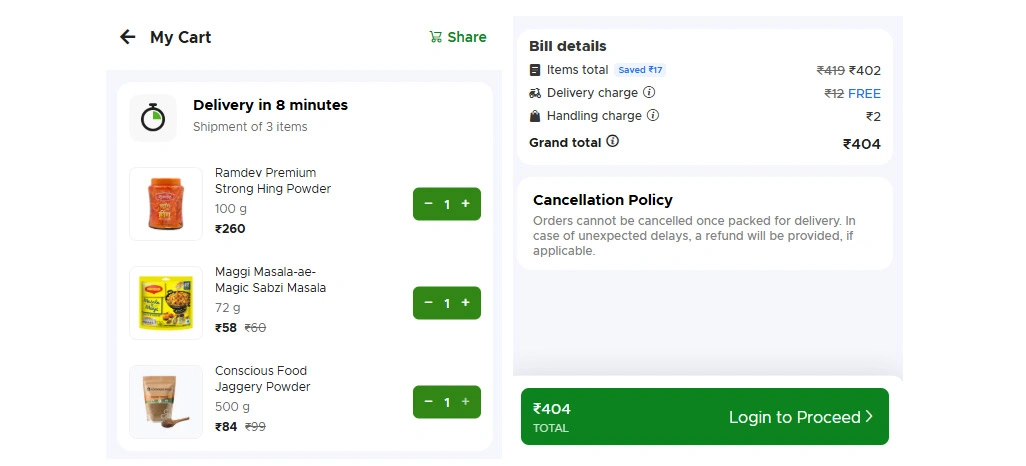
MRP differences become more informative when pricing records are examined across categories, product types, and collection periods. A broad dataset can reveal whether discounts are concentrated within specific grocery segments or distributed more evenly across an assortment. Blinkit Price vs MRP Data Scraping can collect comparable pricing fields that allow analysts to calculate the difference between MRP and selling prices for individual products.
When these records are aggregated, businesses can evaluate average discount levels, identify unusual price gaps, and observe how pricing behavior differs between categories. Location and timing can also influence the prices presented to customers. Inventory availability, demand, promotional activity, and local operations may contribute to differences in observed selling prices.
This makes the dataset more useful for ongoing market analysis. Blinkit Price Monitoring can help businesses maintain recurring observations so that significant price movements are recorded rather than overlooked. Comparing multiple collection periods can show whether a category consistently maintains a particular discount range or experiences occasional deeper reductions.
| Product Category | Average MRP | Average Selling Price | Average Gap |
|---|---|---|---|
| Snacks | ₹120 | ₹105 | ₹15 |
| Beverages | ₹150 | ₹132 | ₹18 |
| Personal Care | ₹280 | ₹245 | ₹35 |
| Staples | ₹210 | ₹193 | ₹17 |
Category-level comparisons can provide a clearer understanding of where promotional activity appears most frequently. For example, a category showing a larger average gap may have more active promotional pricing, while another category may remain closer to its MRP. These observations should be evaluated across sufficient collection periods because temporary campaigns can significantly affect individual measurements.
Category-level analytical activities include:
- Compare discount levels across product categories
- Identify categories with frequent price movements
- Review unusual MRP-to-selling-price differences
- Maintain category-level historical pricing records
Businesses can monitor average gaps, compare categories, identify products with unusual changes, and maintain historical reference points for future studies. This structured approach makes pricing analysis more consistent and allows teams to evaluate quick commerce price behavior using comparable records.
How Retail Scrape Can Help You?
We can collect and organize grocery pricing information from quick commerce platforms into structured datasets suitable for research and analysis. By examining Blinkit MRP vs Selling Price Data within a consistent dataset, businesses can evaluate product-level MRP, selling prices, discounts, categories, and availability.
Automated collection reduces repetitive manual work while helping teams maintain comparable records across different collection periods. The resulting datasets can support competitive research, pricing studies, promotional evaluation, and market intelligence activities.
Key capabilities include:
- Automated product information collection
- Structured MRP and selling-price datasets
- Scheduled pricing data extraction
- Category-level price comparison
- Historical pricing dataset development
- Customized reporting for analytical requirements
The collected information can be integrated into analytical workflows where businesses review pricing changes, compare products, and evaluate category-level movements. Historical records also make it easier to distinguish temporary promotional changes from recurring pricing patterns.
The collected information can also be prepared for automated workflows where pricing records need to be refreshed regularly. Blinkit API integration can support structured data access for recurring analytical processes, allowing teams to incorporate updated pricing information into their existing systems and reporting environments.
Conclusion
Understanding the difference between MRP and actual selling prices provides useful context for evaluating quick commerce pricing behavior. Blinkit MRP vs Selling Price Data can help analysts identify discount patterns, product-level variations, category differences, and pricing movements across collection periods. Consistent datasets make these comparisons easier to measure and interpret.
Structured analysis can also support promotional evaluation and competitive research. Blinkit MRP vs Selling Price Analysis can turn collected pricing records into organized insights for retailers, researchers, and market intelligence teams. Contact Retail Scrape to build reliable pricing datasets and support customized quick commerce data extraction and analysis.