
What Makes an End-to-End Data Analytics Pipeline with Web Scraping Important for Visual Analytics?
Introduction
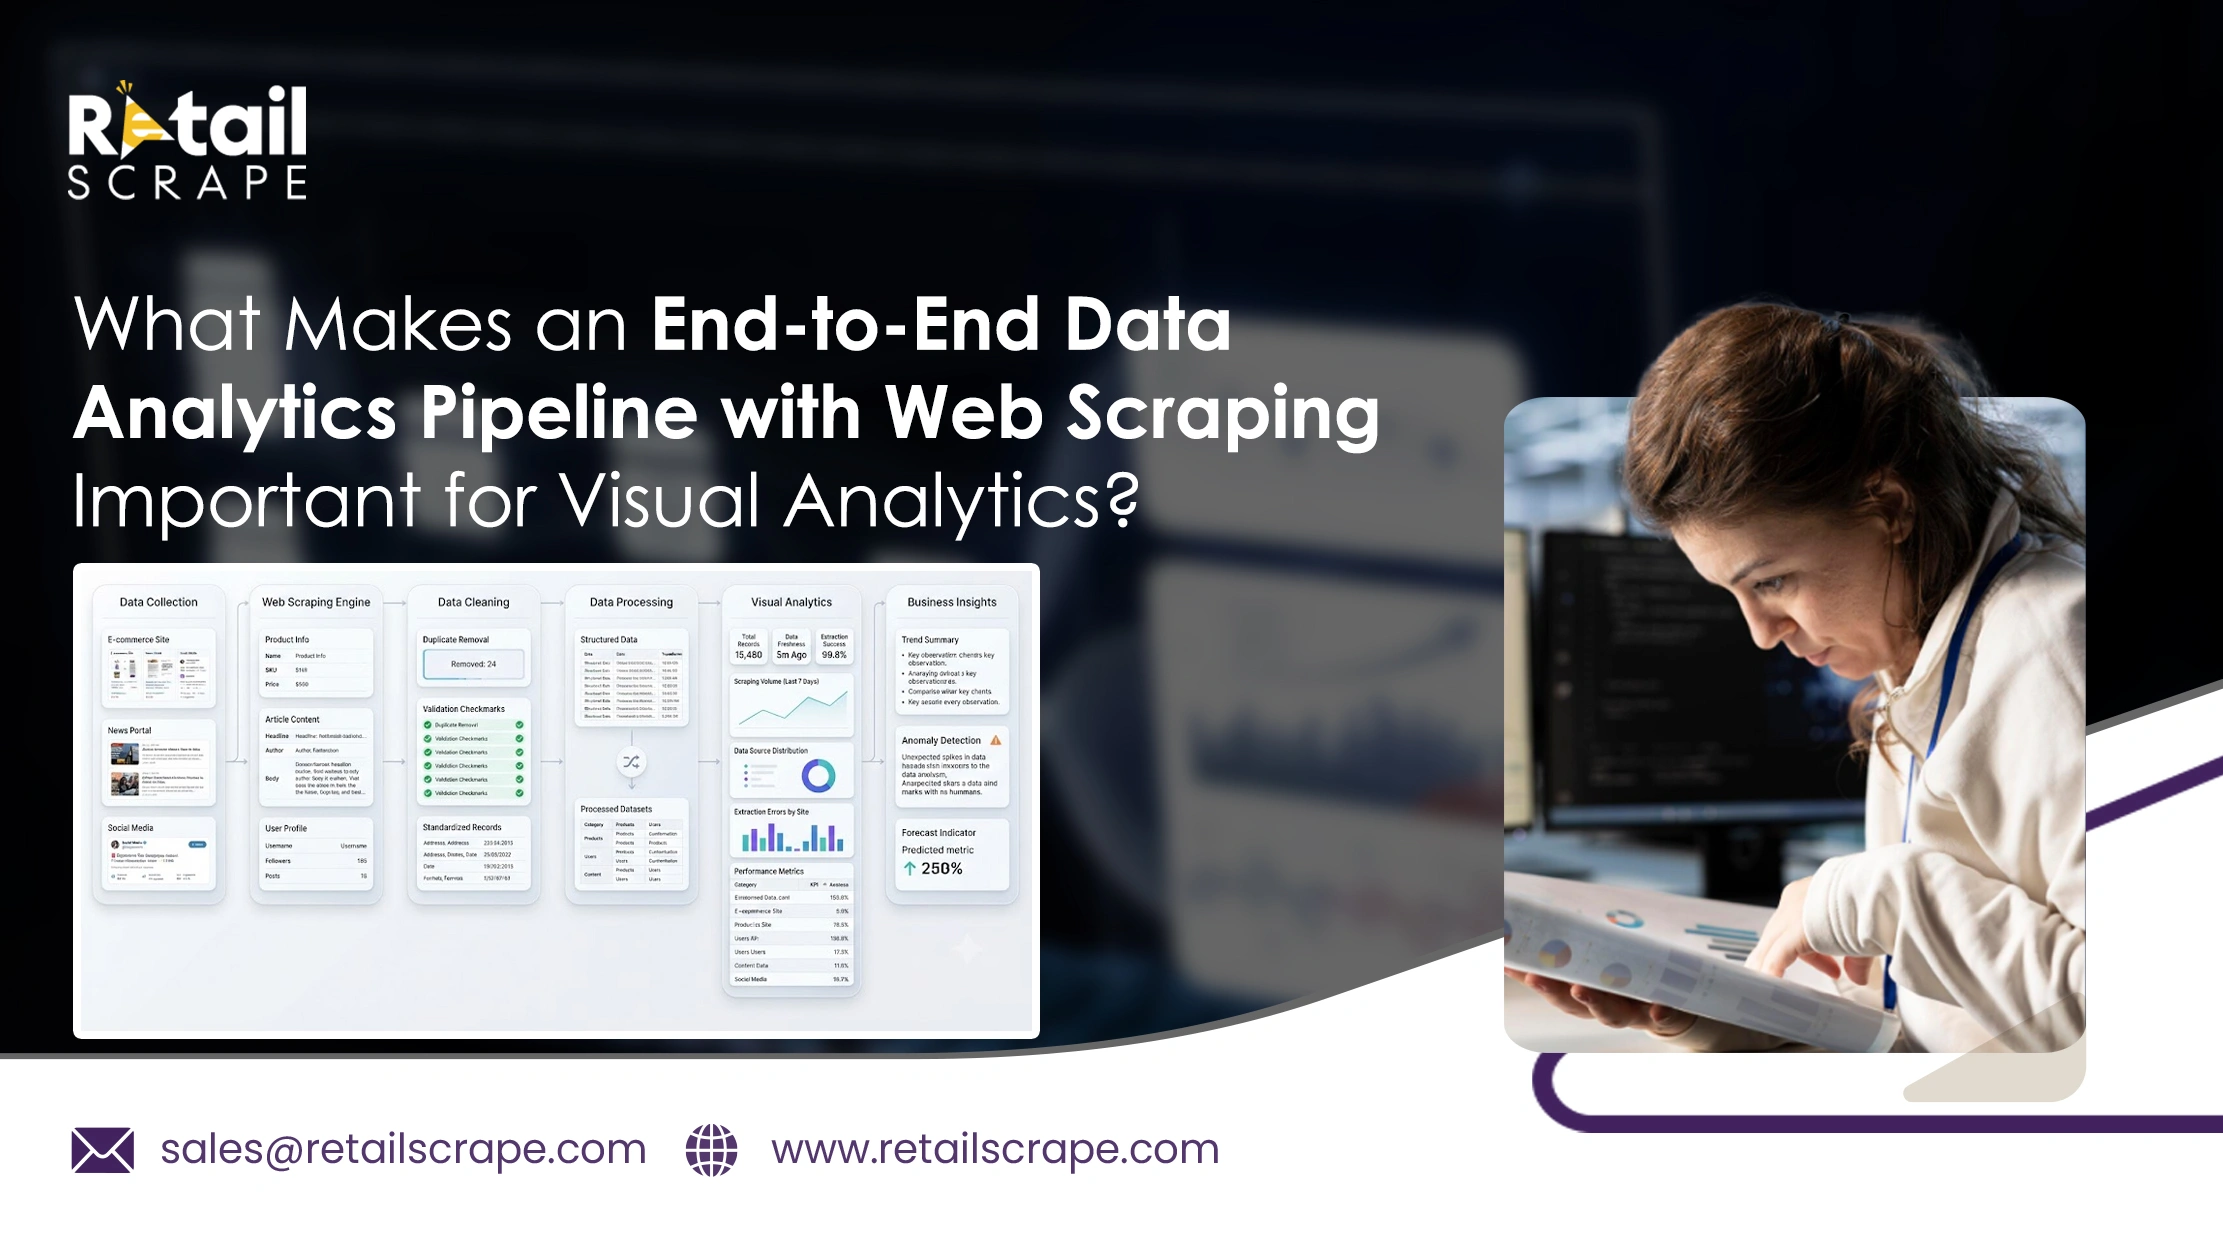
Organizations today generate enormous volumes of structured and unstructured information from websites, applications, and digital platforms. However, collecting data alone is not enough. An effective End-to-End Data Analytics Pipeline With Web Scraping enables companies to gather, clean, process, and visualize information without relying on fragmented workflows.
Modern enterprises increasingly depend on dashboards and visual reports to monitor customer behavior, pricing trends, inventory movements, and market changes in real time. Whether organizations are tracking competitor pricing, consumer preferences, or Map Monitoring Solutions, integrating automated collection with visualization creates a reliable decision-support framework.
This structured workflow enhances operational efficiency while supporting data-driven planning across retail, healthcare, finance, travel, and logistics industries. By combining scalable extraction technologies with visualization platforms, organizations create a dependable ecosystem where every stage of data processing contributes to faster business intelligence and improved long-term performance.
Establishing Strong Foundations Through Accurate Information Management Processes
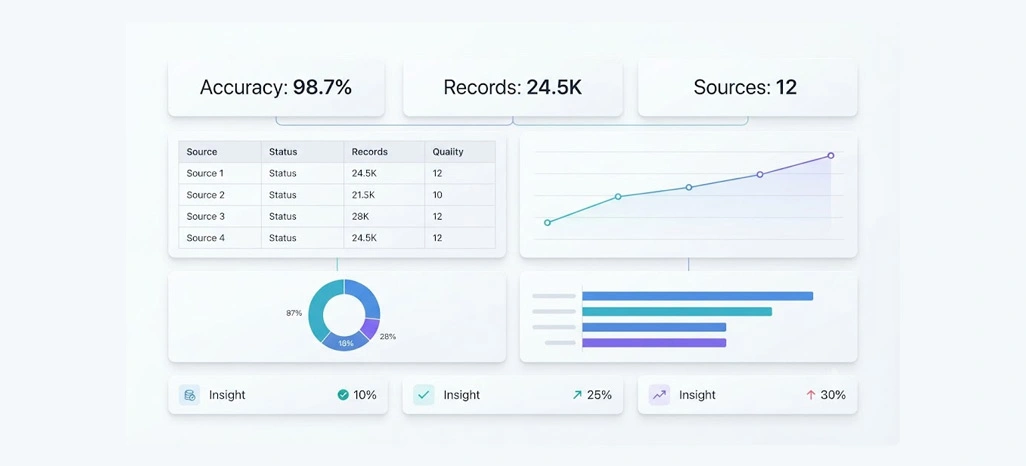
Organizations aiming to build reliable analytics systems must first establish dependable methods for collecting and validating information from multiple digital sources. In the middle of this structured process, Data Collection to Visualization With Web Scraping connects raw information with organized analytical workflows, ensuring datasets remain accurate, complete, and suitable for business intelligence initiatives.
Businesses collecting information from websites, applications, and online marketplaces often encounter duplicate records, inconsistent formatting, and incomplete datasets. Integrating iOS App Scraping into broader collection strategies enables organizations to capture structured mobile application information alongside web-based sources. This improves reporting consistency while helping decision-makers compare customer behavior, pricing patterns, and digital engagement without relying on manually consolidated spreadsheets.
Reliable reporting also depends on presenting complex datasets in an understandable format for executives and operational teams. Incorporating a Data Visualization Dashboard within the analytics workflow enables stakeholders to monitor trends, compare historical performance, and identify operational changes through intuitive visual representations instead of lengthy spreadsheets.
| Metric | Value |
|---|---|
| Time spent preparing data | 80% |
| Data accuracy improvement | Up to 45% |
| Manual processing reduction | Up to 60% |
| Faster reporting preparation | Up to 50% |
When organizations prioritize accurate collection, standardized processing, and meaningful visualization, they establish a dependable analytical foundation that supports forecasting, operational monitoring, and strategic planning.
Streamlining Continuous Information Processing Across Multiple Business Operations
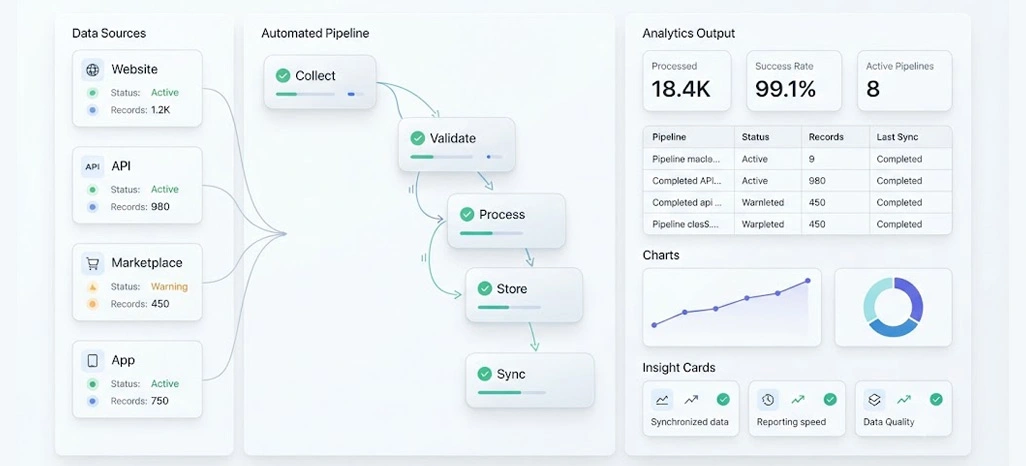
As businesses expand their digital presence, manually managing growing datasets becomes increasingly difficult and resource-intensive. Research indicates that organizations implementing automated workflows significantly improve reporting speed while reducing operational bottlenecks. Positioned within this workflow, Data Pipeline Automation minimizes repetitive tasks and creates dependable processing systems that support enterprise-wide reporting initiatives.
Organizations handling information from multiple online platforms require scalable integration methods capable of delivering refreshed datasets without repeated manual intervention. Implementing a Data Pipeline Using Web Scraping API allows structured information to move efficiently into centralized storage and reporting environments.
Automation also strengthens collaboration by allowing departments to access synchronized datasets that maintain consistent formatting and quality standards. Rather than allocating resources toward repetitive preparation activities, teams can focus on interpreting business patterns, evaluating market developments, and supporting strategic initiatives with dependable analytical outputs.
| Metric | Value |
|---|---|
| Reporting speed improvement | 55% |
| Manual errors reduced | 40% |
| Operational efficiency increase | 50% |
| Workflow consistency improvement | 46% |
Businesses adopting automated information management create sustainable workflows capable of supporting expanding data volumes without sacrificing quality, consistency, or operational efficiency across multiple business functions.
Converting Structured Information Into Meaningful Business Intelligence Visualizations
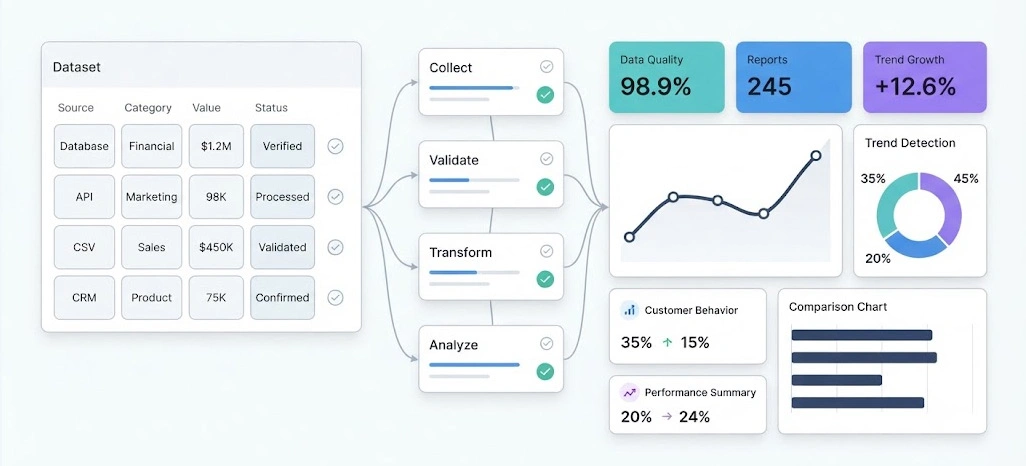
The true value of collected information emerges only after it is transformed into insights that decision-makers can understand quickly and confidently. Positioned within this analytical workflow, Automated Data Collection and Visualization ensures information moves efficiently from validated datasets into meaningful graphical reports that simplify complex business intelligence.
A well-designed Web Scraping Data Pipeline supports continuous information flow from online sources into reporting environments while maintaining data quality throughout every processing stage. Consistent transformation methods reduce inconsistencies and enable organizations to compare historical records, market trends, customer behavior, and operational performance using standardized analytical frameworks.
Visual reporting strengthens executive decision-making by replacing static spreadsheets with dynamic charts, dashboards, and graphical summaries that highlight important performance indicators. These reporting capabilities improve collaboration between technical and non-technical stakeholders by presenting complex analytical findings in formats that are easier to interpret and communicate across the organization.
| Metric | Value |
|---|---|
| Dashboard adoption increase | 65% |
| Decision-making speed | 58% Faster |
| Reporting consistency | 47% Improvement |
| Executive reporting efficiency | Up to 52% |
Meaningful visual analytics not only simplify information interpretation but also strengthen long-term planning by providing reliable insights that guide business growth and continuous operational improvement.
How Retail Scrape Can Help You?
Businesses looking to transform scattered online information into meaningful insights require more than basic extraction services. By implementing an End-to-End Data Analytics Pipeline With Web Scraping, organizations receive structured datasets ready for reporting, analytics, forecasting, and operational intelligence.
Combined with Enterprise Web Crawling, our solutions handle large-scale data acquisition while maintaining consistency, quality, and reliability across multiple digital sources.
Our experienced team provides comprehensive support throughout every stage of the analytics lifecycle through:
- Collecting structured information from multiple online platforms.
- Cleaning inconsistent records for higher reporting accuracy.
- Standardizing datasets for seamless business integration.
- Scheduling recurring extraction without manual intervention.
- Delivering analytics-ready outputs for reporting systems.
- Supporting scalable processing across expanding business operations.
Conclusion
Modern organizations require more than isolated data collection processes to remain competitive. A structured End-to-End Data Analytics Pipeline With Web Scraping transforms scattered online information into organized business intelligence that supports accurate reporting, forecasting, and executive decision-making.
When combined with Data Visualization From Web Scraped Data, organizations can simplify complex datasets into meaningful visual insights that improve operational visibility and strategic planning across multiple business functions.
Organizations implementing End-to-End Data Pipeline: Scraping to Visualization establish dependable processes that reduce manual effort while strengthening analytical capabilities across departments. Partner with Retail Scrape today to build a scalable analytics ecosystem that converts web data into actionable business intelligence and supports confident decision-making for future growth.
Effortlessly managing intricacies with customized strategies.
Mitigating risks, navigating regulations, and cultivating trust.
Leveraging expertise from our internationally acclaimed team of developers
Reliable guidance and assistance for your business's advancement