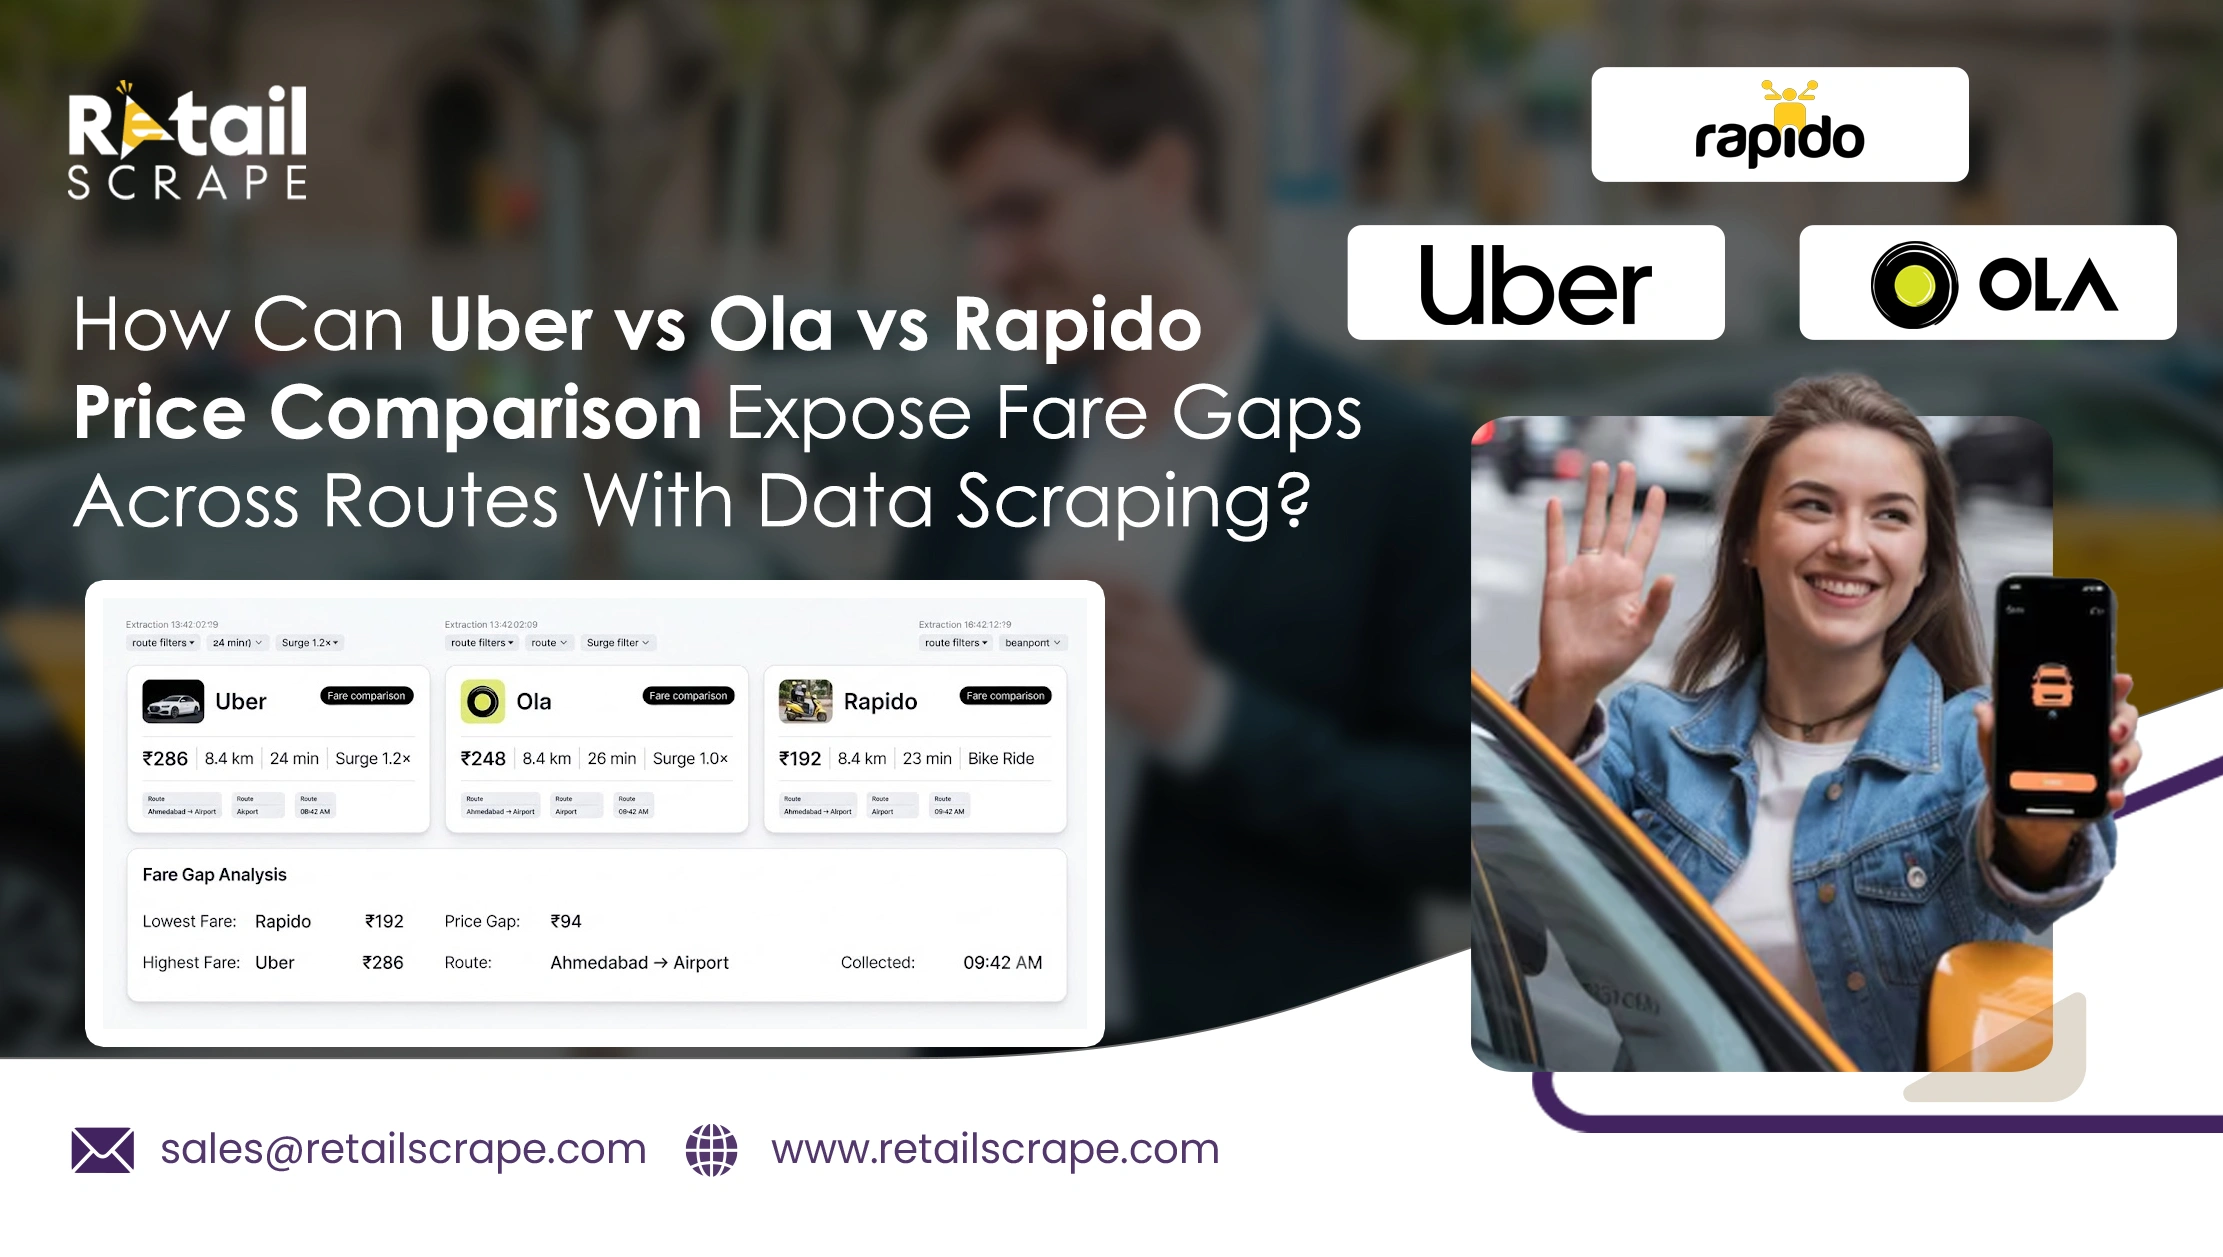
How Can Uber vs Ola vs Rapido Price Comparison Expose Fare Gaps Across Routes With Data Scraping?
Introduction
Ride-hailing fares can differ considerably across platforms even when passengers travel between the same pickup and destination points. Uber, Ola, and Rapido may apply different base fares, surge charges, discounts, vehicle categories, and demand-based adjustments. Comparing these factors helps businesses understand pricing variations across routes, locations, and travel periods.
This makes it easier to recognize expensive routes, competitive pricing windows, and changes influenced by demand. Uber vs Ola vs Rapido Price Comparison provides a structured way to evaluate these differences through collected pricing information. Data scraping can capture fare estimates across multiple routes and time slots, allowing analysts to identify recurring pricing patterns.
For transportation businesses and market researchers, consistent fare monitoring can support pricing research and customer-focused strategies. Comparing peak and non-peak periods can also reveal how distance, location, vehicle type, availability, promotions, and demand affect final costs. These insights create a stronger foundation for studying India's rapidly developing ride-hailing market.
Comparing Fare Differences Across Routes and Ride Platforms
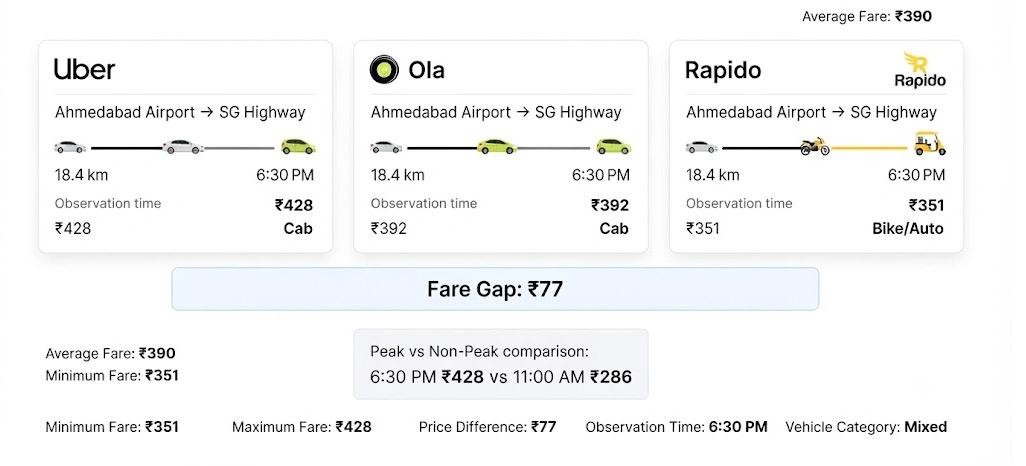
Businesses can collect pricing information from multiple ride-hailing platforms while keeping pickup points, destinations, vehicle categories, and observation times consistent. This creates a reliable foundation for identifying differences that may otherwise remain hidden when prices are checked manually. A structured Compare Uber Ola Rapido Fares approach can also help analysts organize route-level observations and evaluate how prices change throughout the day.
Fare variations can become more noticeable during office hours, weekends, holidays, or periods of increased passenger demand. Repeated observations across the same routes help distinguish temporary fluctuations from recurring pricing behavior. For example, a route showing a higher fare every weekday evening may indicate a consistent demand pattern rather than an isolated increase.
- Record fares at fixed time intervals
- Compare identical pickup and destination combinations
- Separate vehicle categories during analysis
- Track peak and non-peak observations
- Maintain historical records for benchmarking
A broader Ride Pricing Intelligence India dataset can bring these observations together across different cities and travel conditions. Analysts can examine average fares, minimum and maximum prices, price differences, and frequency of fluctuations. This approach is particularly useful when businesses want to understand whether fare gaps are connected with distance, demand, location, or platform-specific pricing strategies.
| Comparison Factor | Sample Benchmark |
|---|---|
| Platforms monitored | 3 |
| Route distance | 10 km |
| Daily time slots | 4 |
| Monitoring period | 7 days |
| Pricing variables | 5 |
Such structured information provides a clearer view of route-level pricing behavior and supports more consistent competitive analysis.
Tracking Route-Level Pricing Changes With Structured Collection
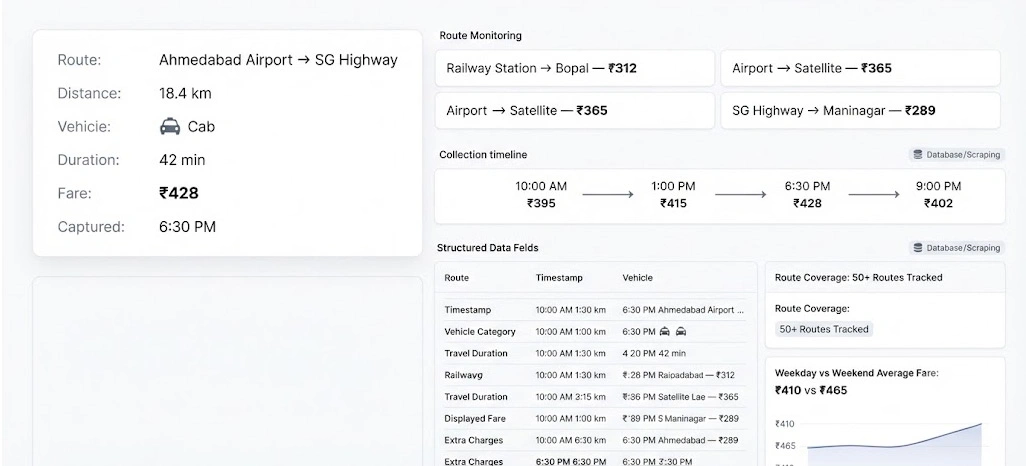
A structured scraping process can collect fare estimates for identical routes while recording important attributes such as timestamps, vehicle categories, estimated travel duration, and displayed charges. Using Cab Fare Comparison Using Web Scraping within this framework allows businesses to compare observations gathered under similar conditions rather than depending on occasional manual checks.
Route coverage can be expanded according to the research objective. A small study may monitor 10 routes, while a larger project can cover 25, 50, or more routes across several locations. Repeated collection makes it possible to calculate average fares and identify routes where price differences remain consistently high or fluctuate sharply.
- Monitor multiple routes at regular intervals
- Capture vehicle category and estimated duration
- Record displayed prices and applicable charges
- Compare weekday and weekend movements
- Preserve historical observations for analysis
Businesses can also examine how route characteristics influence fare differences. Longer distances, traffic-heavy areas, airport routes, business districts, and residential zones may show different pricing behavior. Combining route information with time-based observations creates a more detailed picture of competitive fare movements.
| Route Analysis Metric | Sample Value |
|---|---|
| Routes monitored | 25 |
| Daily observations | 100 |
| Vehicle categories | 4 |
| Peak periods checked | 3 |
| Weekly observations | 700+ |
This structured approach makes route-level benchmarking more consistent and helps analysts identify recurring pricing patterns across different travel conditions.
Identifying Competitive Fare Patterns Through Continuous Monitoring
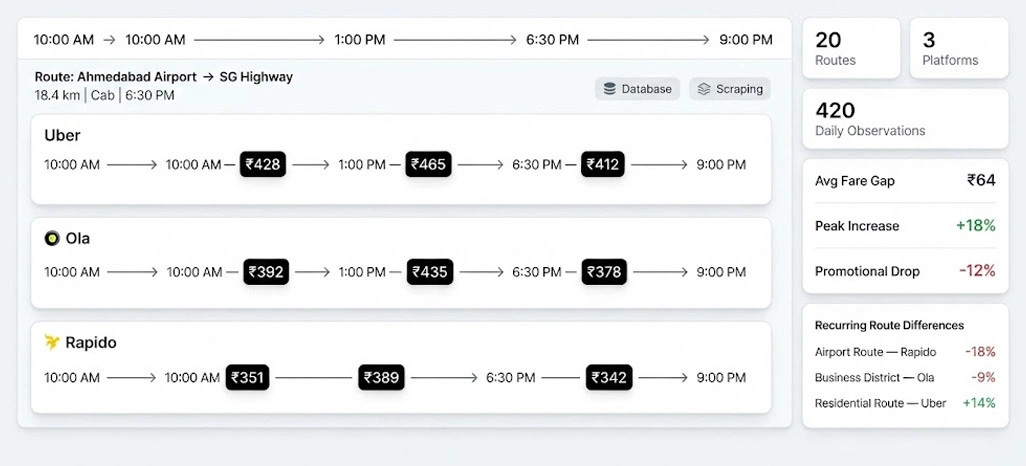
Ongoing monitoring provides a broader view of how ride prices respond to changing market conditions. Instead of relying on one-time observations, businesses can compare fare movements across multiple dates and time periods. Real-Time Price Tracking Services can support this process by maintaining frequent observations that capture sudden increases, promotional reductions, and changes associated with higher demand.
Consistent collection also helps analysts identify whether one platform frequently offers lower fares for particular routes or vehicle categories. A dataset covering 20 routes across three platforms can produce hundreds of daily observations, creating enough information to calculate averages and compare pricing volatility. These comparisons can reveal both stable and temporary competitive differences.
- Monitor prices during high-demand periods
- Compare platform-level average fares
- Track promotional and discounted prices
- Identify recurring route-specific differences
- Measure changes across multiple time periods
Using Competitor Ride Pricing Data alongside route, timing, and vehicle information can make competitive benchmarking more detailed. Analysts can evaluate which factors appear alongside pricing changes and determine whether fare gaps are concentrated in specific locations or travel windows. This can support transportation research, market evaluation, and pricing trend studies.
| Monitoring Indicator | Example Result |
|---|---|
| Platforms compared | 3 |
| Routes observed | 20 |
| Daily checks | 4 |
| Weekly observations | 1,680+ |
| Pricing indicators | 6 |
Continuous data collection ultimately provides stronger evidence for understanding fare movements and competitive pricing behavior across routes.
How Retail Scrape Can Help You?
We can support structured collection of ride pricing information from multiple platforms and organize it into datasets suitable for detailed analysis. With Uber vs Ola vs Rapido Price Comparison, businesses can examine fare variations across routes, time periods, vehicle categories, and demand conditions without depending on isolated manual checks or fragmented records.
The collected information can support several practical applications:
- Route-level fare benchmarking across competing platforms
- Monitoring price changes during peak and non-peak periods
- Comparing vehicle-category pricing across selected locations
- Identifying recurring fare gaps between competing services
- Evaluating promotional pricing and discount patterns
- Organizing historical fare records for trend analysis
A structured data collection framework can also support Taxi Price Monitoring by maintaining consistent records of fare movements across selected routes. Businesses can use these datasets to evaluate pricing behavior, identify recurring market patterns, and compare competitive movements over time. We can further customize collection frequency, route coverage, and data fields according to specific research requirements.
By organizing collected information into usable datasets, businesses can reduce repetitive manual research and create a dependable foundation for transportation market analysis. Historical records can also help teams compare current observations with earlier pricing behavior and identify meaningful changes across different routes and travel periods.
Conclusion
Consistent fare monitoring helps businesses understand how ride prices differ across platforms, routes, and demand periods. Uber vs Ola vs Rapido Price Comparison provides a practical framework for identifying recurring fare gaps and evaluating pricing movements through structured data collection. These insights can support stronger benchmarking and transportation market research.
Accurate datasets also make Uber vs Ola vs Rapido Fare Comparison more useful for identifying competitive pricing movements and route-specific opportunities. With organized historical and current fare information, businesses can build clearer pricing benchmarks and support informed mobility analysis. Contact Retail Scrape today to discuss your ride pricing data collection requirements and build a customized scraping solution.