
What Does Airbnb Dynamic Pricing Analysis Reveal About Demand, Pricing, and Market Competition?

Introduction
Airbnb markets change quickly as hosts adjust nightly rates, availability, minimum stays, and discounts according to local demand. For investors, property managers, travel platforms, and analysts, understanding these movements requires more than checking individual listings. Structured market data helps reveal recurring pricing patterns, demand shifts, and competitive positioning across destinations.
A consistent approach to Airbnb Dynamic Pricing Analysis can show how rates respond to weekends, holidays, events, seasonality, and neighborhood-level demand across property types and segments. Comparing historical and current observations also helps identify pricing gaps, unusually high or low rates, and locations where supply conditions are changing faster than expected.
Airbnb web scraping supports this process by collecting listing prices, property details, availability, ratings, and location attributes at scale. When these datasets are organized and monitored regularly, businesses can evaluate market behavior with greater clarity, refine pricing strategies, and make informed decisions about expansion, investment, positioning, and revenue opportunities.
Pricing Patterns Reveal Changing Demand Across Airbnb Markets
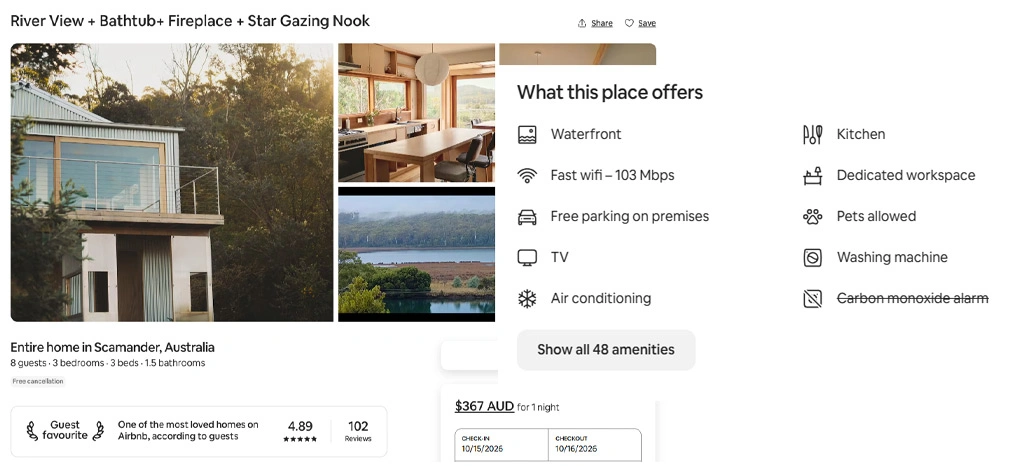
Pricing movements provide valuable signals about changing demand across short-term rental markets. By examining average nightly rates, weekend premiums, discounts, minimum-stay requirements, and availability, businesses can understand how hosts respond to market conditions. Airbnb Rental Price Analysis can bring these observations together to identify pricing differences between property categories and booking periods. Comparing these movements with competitor listings also provides useful context for evaluating positioning and identifying areas where rates appear unusually high or low.
Market pricing becomes more meaningful when observations are collected consistently rather than reviewed as isolated snapshots. Historical records can show whether rate increases are connected to seasonal demand, special events, holidays, or sustained changes in visitor activity. Analysts can also identify repeated patterns in specific property segments and determine whether pricing behavior differs between weekdays and weekends. This makes structured data useful for revenue planning and market assessment.
Businesses can further examine several indicators when interpreting rental pricing behavior:
- Average nightly rates across comparable properties
- Weekend and weekday pricing differences
- Changes in minimum-stay requirements
- Frequency of discounts and promotions
- Availability changes across booking periods
| Market Indicator | Analytical Purpose |
|---|---|
| Average rate | Measures general pricing levels |
| Weekend premium | Indicates short-term demand pressure |
| Discount frequency | Reflects competitive behavior |
| Availability | Provides supply-related signals |
| Stay requirements | Shows host strategy |
When these signals are evaluated together, pricing movements can reveal more than simple rate changes. Airbnb Competitor Price Analysis can help businesses understand how comparable listings respond to similar demand conditions and whether a property is positioned competitively. Such comparisons support better segmentation, pricing decisions, and market planning without relying solely on manual listing checks.
Geographic Pricing Differences Explain Competitive Market Conditions
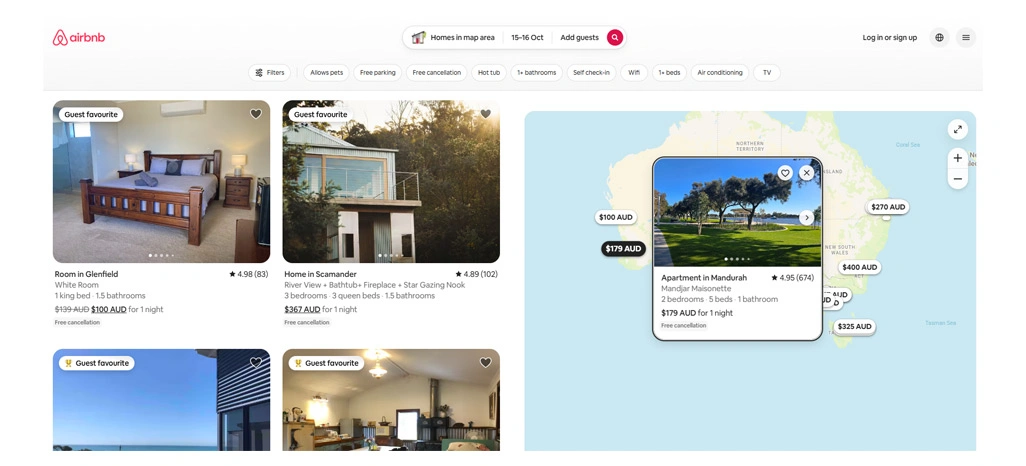
Location plays an important role in determining rental prices because demand varies considerably between cities, districts, tourist zones, business centers, and residential neighborhoods. Airbnb Price Trends by City can help businesses compare pricing movements across major destinations while identifying locations experiencing stronger or weaker changes. A citywide average, however, may not reflect neighborhood-level differences, making geographic segmentation important when evaluating rental market conditions.
Detailed location-based datasets can reveal how nearby properties differ in price, availability, property type, ratings, and amenities. Businesses can use these observations to identify high-value districts, emerging areas, and markets where competitive pressure is increasing. Airbnb Price Comparison by Location provides an additional layer of analysis by allowing similar properties to be assessed across specific geographic areas rather than relying only on broad city-level averages.
Useful geographic indicators include:
- Average rates across selected neighborhoods
- Property density within specific districts
- Availability patterns by location
- Differences between central and peripheral areas
- Seasonal pricing movements across destinations
| Geographic Factor | Business Relevance |
|---|---|
| City | Supports broad market comparison |
| Neighborhood | Shows local pricing variation |
| Property density | Indicates supply concentration |
| Location type | Helps segment visitor demand |
| Seasonal activity | Highlights periodic changes |
Geographic comparisons become increasingly valuable when collected over extended periods. They can show which districts consistently command higher rates and which locations experience greater fluctuations. This information helps property managers, investors, travel businesses, and analysts evaluate expansion opportunities while understanding how location influences market competition and rental performance.
Rental Data Highlights Emerging Opportunities Across Market Segments
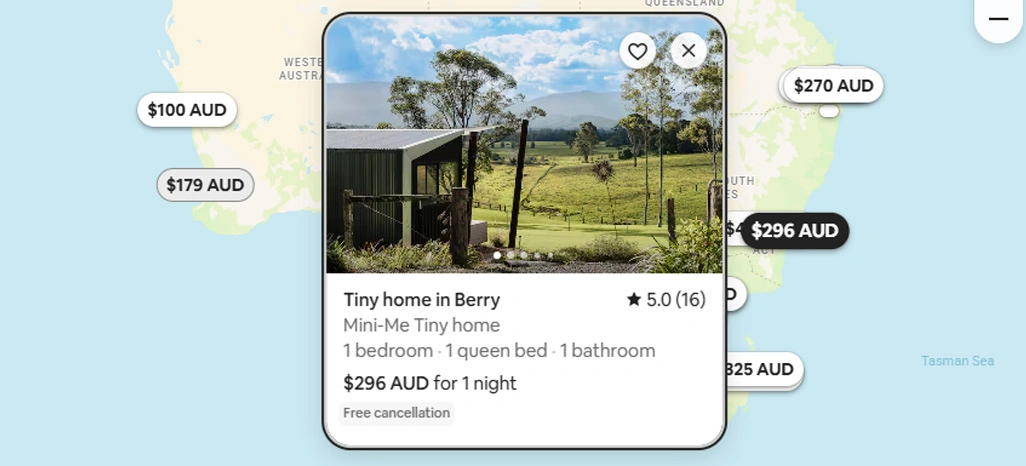
Comprehensive rental datasets allow businesses to evaluate market conditions across multiple property segments instead of concentrating on individual listings. Airbnb Market Analysis Data can combine pricing, availability, property types, amenities, ratings, and geographic attributes to create a broader view of market activity. These combined observations help analysts understand how different segments perform and where pricing or supply conditions may be changing.
Market research becomes more effective when data is organized into consistent categories. Airbnb Rental Market Research can help businesses compare apartments, houses, private rooms, luxury properties, and other accommodation segments according to their pricing and availability patterns. Analysts can then evaluate whether specific categories are experiencing stronger demand, increasing competition, or changes in average rates over time.
Businesses can examine several important data points, including:
- Property categories and accommodation types
- Nightly rates across rental segments
- Availability and supply conditions
- Ratings and review indicators
- Amenities and property characteristics
| Dataset Category | Analytical Value |
|---|---|
| Property type | Supports segment comparison |
| Listing details | Improves property evaluation |
| Availability | Indicates supply conditions |
| Ratings | Supports quality benchmarking |
| Amenities | Enables feature comparisons |
Consistent collection also makes it easier to identify emerging opportunities and potential risks. Airbnb Rental Price Data can show how rates differ between property categories, locations, and booking periods, helping analysts recognize premium segments and pricing gaps.
Combining pricing, availability, property details, and location data helps businesses make informed market assessments, investment decisions, and competitive strategies. AirbnbRental Price Monitoring further supports this process by providing clearer insights into changing rental patterns.
How Retail Scrape Can Help You?
We can support Airbnb Dynamic Pricing Analysis by collecting structured rental listing information and transforming scattered observations into organized datasets. Businesses can use this information to evaluate rental rates, property details, availability, locations, ratings, amenities, and competitor movements across selected markets.
Key capabilities include:
- Automated rental listing data collection
- Regular monitoring of pricing movements
- Location-based rental market segmentation
- Property attribute extraction at scale
- Historical data collection for comparisons
- Structured datasets for business analysis
With recurring data collection, businesses can compare pricing conditions across destinations and identify meaningful changes over time. Airbnb Price Trends Using Web Scraping can support this process by converting repeated listing observations into structured pricing intelligence.
We can also integrate an Airbnb Rental Data API into analytical workflows, allowing teams to use organized rental information for dashboards, reports, benchmarking systems, and ongoing market intelligence programs.
Conclusion
Airbnb markets continuously produce changing signals through rental prices, availability, locations, property categories, and competitive activity. Airbnb Dynamic Pricing Analysis brings these elements together to help businesses understand demand movements, seasonal pricing behavior, geographic differences, and competitive conditions. Structured data makes these market signals easier to compare and interpret for strategic planning.
Consistent data collection can strengthen pricing decisions by providing a clearer view of market movement and rental positioning. Airbnb Rental Price Monitoring helps businesses observe meaningful rate changes over time and identify emerging shifts before making important decisions. Contact Retail Scrape today to build a structured Airbnb data solution tailored to your pricing research, market intelligence, and competitive analysis requirements.