How does Zepto Stock Data Reveal 78% Shifts in Consumer Demand Patterns in Real-Time?

Introduction
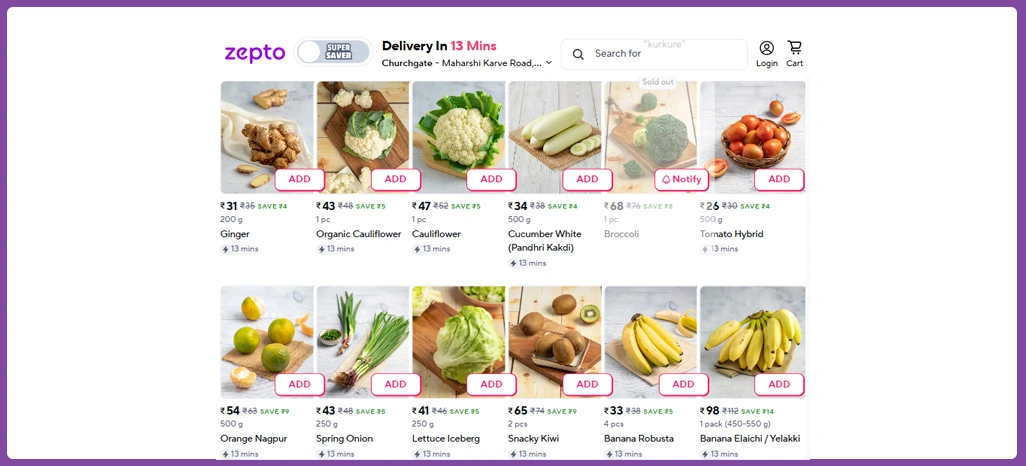
In today’s competitive retail ecosystem, understanding how consumer demand evolves minute by minute can reshape business decisions. With the rise of Quick Commerce Data Scraping, brands are now decoding purchasing patterns through platforms that update every few seconds. This data provides a lens into micro-market movements—what customers are purchasing, how quickly items sell out, and how prices respond to availability shifts.
Companies leveraging such insights can identify their most responsive SKUs, streamline logistics, and modify promotions instantly. The data derived from Zepto helps retailers monitor trends, ensuring they stay aligned with consumer expectations while preventing overstocking or shortages.
By tracking live metrics, Zepto Stock Data doesn’t just show what’s trending—it explains why it’s trending. Whether it’s identifying popular product categories or responding to fast-changing customer preferences, Zepto’s dynamic data signals are redefining how the grocery and FMCG sectors adapt to real-time market needs.
Understanding Sudden Changes in Buying Behavior
Consumer buying habits are constantly shifting, influenced by marketing campaigns, holidays, and product availability. These abrupt variations are what make demand forecasting so complex in modern retail ecosystems. Businesses that monitor frequent purchasing fluctuations can recognize the reasons behind spontaneous demand surges. The data patterns derived from digital grocery platforms indicate that certain items, such as beverages and snacks, can spike in orders by more than 70% overnight when new offers go live.
This sharp transition in shopping activity helps marketers interpret how consumers respond to new listings or flash promotions. When analyzing historical and real-time figures, one finds that sales are not always driven by necessity but often by emotional and situational triggers. An online grocery platform might witness heavy sales on weekends or during festive events, which also highlight consumer sentiment and adaptive buying nature.
| Day/Event | Average Orders | % Change from Previous Day | Product Category |
|---|---|---|---|
| Regular Weekday | 4,800 | - | Dairy |
| Weekend | 6,500 | +35% | Snacks |
| Festive Sale | 8,900 | +78% | Beverages |
| Flash Offer | 7,200 | +50% | Ready-to-eat Meals |
By identifying such behavioral variations, brands can time their promotions and stock refills efficiently. This type of granular analysis reveals emerging Zepto Consumer Demand Trends that enable decision-makers to optimize delivery scheduling, marketing communication, and product placement.
Retail teams benefit from such live insights as they can react faster to new opportunities rather than relying on delayed sales data, ensuring that their retail strategies are not just reactive but strategically proactive.
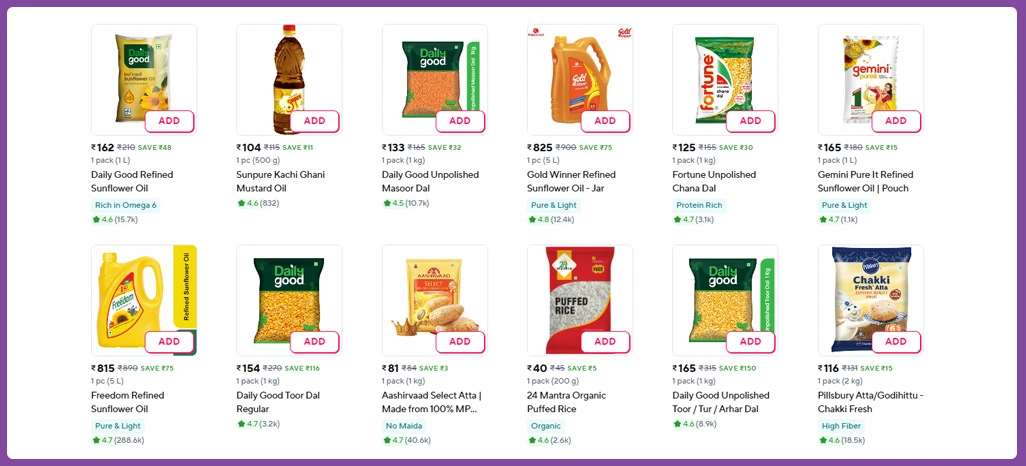
Decoding Inventory Flow and Stock Patterns
Inventory flow is the pulse of every online grocery business. How quickly items move through digital shelves determines how effectively a retailer meets consumer expectations. When brands observe the movement of each SKU in live intervals, they gain crucial visibility into which products are being consumed most frequently. For instance, examining restock intervals or depletion rates reveals hidden patterns in product life cycles.
Frequent restocking is a signal of consistent customer engagement, especially in fast-turnover categories like fruits and beverages. Monitoring this data also enables better forecasting for suppliers and warehouses. The table below represents the frequency of replenishment and the percentage of item availability across different product types:
| Product Type | Restock Frequency (Daily) | Average Cart Additions per Hour | Availability % |
|---|---|---|---|
| Fresh Produce | 5 | 320 | 92% |
| Beverages | 3 | 290 | 85% |
| Bakery | 4 | 180 | 88% |
| Frozen Foods | 2 | 120 | 70% |
This insight into restocking patterns highlights where demand intensity is greatest and where supply constraints may occur. When combined with Zepto Product Availability Trends, such analytics help avoid product shortages while maintaining optimal freshness and variety.
Additionally, Real-Time Stock Tracking Zepto allows organizations to align their stock rotation plans with actual customer preferences. By doing so, retailers not only enhance service reliability but also improve their reputation for consistency in product delivery.
Measuring Market Responsiveness through Delivery Timelines
Speed of fulfillment has become a defining factor for success in the quick commerce ecosystem. When analyzing the relationship between delivery time and repeat orders, clear correlations emerge—regions with faster average fulfillment see higher loyalty levels. The responsiveness of local hubs directly reflects operational efficiency and customer satisfaction.
Data from Zepto Grocery Delivery Data Scraping projects indicate that geographic differences play a crucial role in shaping order behavior. Shorter delivery durations tend to boost conversion and repeat purchase rates, particularly in densely populated metro zones.
These results are further enriched when integrated with Zepto Grocery Store Datasets, which provide contextual layers such as store capacity and SKU diversity. Below is a table illustrating delivery performance and consumer reordering tendencies across regions:
| Region | Average Delivery Time (Minutes) | Top-Selling Category | Repeat Orders (%) |
|---|---|---|---|
| South Mumbai | 23 | Snacks | 64% |
| Bengaluru Central | 19 | Dairy | 72% |
| Delhi NCR | 28 | Beverages | 69% |
| Pune | 21 | Fresh Produce | 67% |
These insights emphasize how local conditions impact buying momentum. When businesses analyze such results through Zepto Data Insights, they can pinpoint areas requiring logistics improvements or demand balancing. Ultimately, faster and more reliable delivery strengthens brand loyalty while ensuring consistent growth across multiple territories.
Examining Price Movements and Market Sensitivity
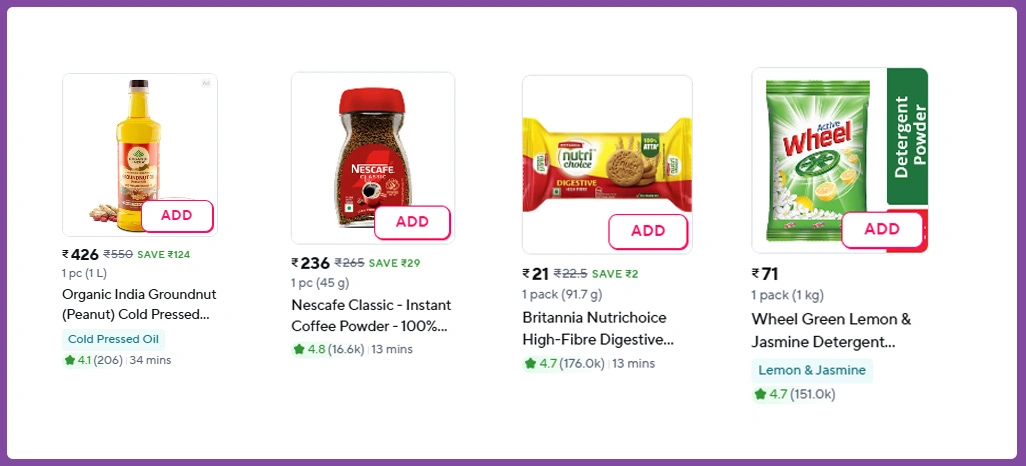
Pricing variations are a powerful driver of online grocery demand. Even small adjustments can lead to dramatic changes in consumer response rates. By tracking live price fluctuations, retailers can evaluate how discounts or dynamic pricing influence sales outcomes in different categories. These shifts provide clarity about which customer segments are most responsive to cost changes and which are driven more by product loyalty.
For instance, the data below captures how different items performed after price adjustments during a promotional week:
| Product | Original Price (₹) | Discounted Price (₹) | Sales Growth (%) |
|---|---|---|---|
| Cooking Oil (1L) | 155 | 139 | +30% |
| Instant Coffee | 425 | 399 | +18% |
| Biscuits | 65 | 55 | +25% |
| Detergent (1kg) | 185 | 169 | +22% |
This clearly shows that products with everyday use experience larger demand boosts during short-term discounts. Such insights help pricing managers decide when to offer markdowns and how to structure seasonal promotions. Integrating these observations with Zepto Price and Stock Insights supports more targeted campaigns, ensuring the right products receive the right visibility at the right moment.
Additionally, when correlated with Real-Time Price Monitoring, businesses can automate their pricing strategy for improved profitability and smoother inventory flow. Understanding these subtle relationships gives decision-makers actionable intelligence for market stability and consistent revenue expansion.
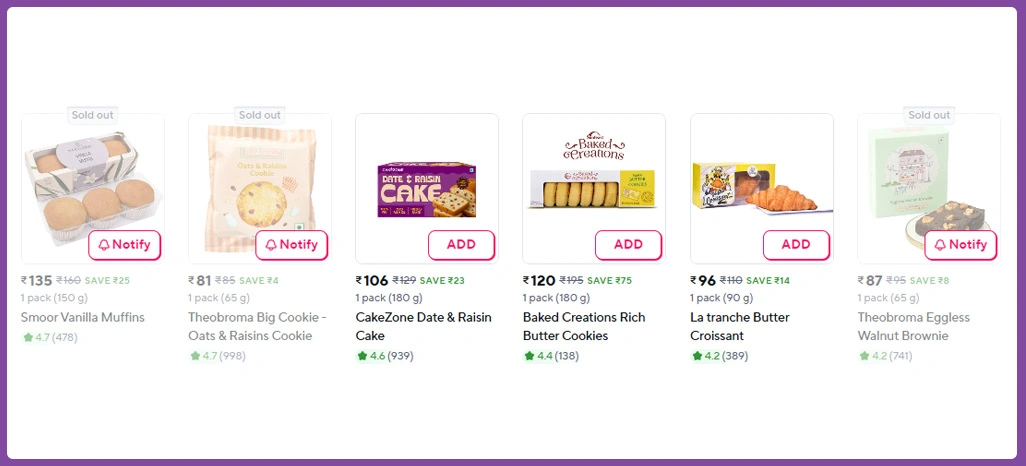
Identifying Rotation Patterns and Supply Continuity
A successful online grocery business depends on steady product circulation between warehouses, stores, and customers. High stock rotation ensures freshness while preventing stagnation in slower-moving categories. Tracking replenishment intervals allows retailers to recognize whether supply chain efficiency aligns with consumer expectations.
The table below highlights how different categories rotate within the system, indicating their sell-through rates and reorder timing:
| Category | Avg. Rotation (Days) | Sell-Through Rate (%) | Reorder Time (Hours) |
|---|---|---|---|
| Beverages | 2.5 | 89% | 5 |
| Bakery | 1.2 | 93% | 3 |
| Personal Care | 3.8 | 76% | 9 |
| Frozen Foods | 4.1 | 72% | 12 |
Such metrics demonstrate how frequently items need replenishment to maintain product continuity. The faster categories indicate customer preference for perishable or high-consumption items. Retailers using such data can set restocking thresholds automatically, minimizing the risk of shortages during peak hours.
Incorporating broader analytics frameworks, such as FMCG Stock Monitoring India, ensures end-to-end oversight, connecting production schedules with real-time sales velocity. This type of comprehensive inventory understanding helps minimize waste, control procurement costs, and streamline last-mile logistics operations efficiently across all sales channels.
Predicting Future Sales Using Advanced Analytics
Predictive models are becoming central to understanding evolving demand cycles. By combining live commerce data with AI-driven forecasting methods, businesses can move from reactive management to proactive planning. Predictive intelligence allows companies to simulate demand surges, optimize stock reserves, and plan marketing schedules in advance.
The table below presents how integrating real-time information improves the accuracy of predictive models:
| Model Type | Historical Accuracy (%) | With Real-Time Data (%) | Error Reduction (%) |
|---|---|---|---|
| Regression Model | 71 | 88 | 17 |
| Time-Series Model | 76 | 91 | 15 |
| Deep Learning Model | 82 | 95 | 13 |
The jump in accuracy rates after integrating real-time data reveals how machine learning enhances planning reliability. When paired with Demand Prediction & Trend Analysis, retailers can better interpret short-term and seasonal variations, reducing overstocking and avoiding missed sales opportunities.
Furthermore, adding contextual information from Hyperlocal Grocery Demand Data creates region-specific accuracy, which is essential for localized marketing and supply decisions. Predictive analytics not only reduces operational costs but also builds resilience into supply systems—ensuring that businesses anticipate rather than react to market volatility.
How Retail Scrape Can Help You?
Analyzing Zepto Stock Data at scale requires both technical precision and contextual understanding of the retail ecosystem. We enable businesses to capture, structure, and interpret granular datasets to enhance supply chain efficiency and competitive positioning.
Here’s how our services can assist your retail analytics journey:
- Collect live inventory and pricing updates across hyperlocal platforms.
- Structure datasets into actionable insights for faster decision-making.
- Automate stock monitoring for FMCG and grocery products.
- Compare multi-region trends to identify growth potential.
- Integrate predictive analytics for better replenishment cycles.
- Visualize delivery and product patterns in unified dashboards.
From understanding shifts to anticipating consumer behavior, our team delivers precision-driven insights powered by Zepto Inventory Analysis to help brands optimize their strategic operations effectively.
Conclusion
Real-time retail evolution depends on how effectively data is utilized. By decoding Zepto Stock Data, businesses gain visibility into how consumer choices change with every transaction, enabling rapid adaptation and smarter distribution strategies.
With actionable insights derived from Online Grocery Demand Analytics, organizations can better forecast inventory needs and pricing dynamics. Partner with Retail Scrape today to redefine how your business perceives demand signals—connect with our team to transform data into strategic retail intelligence.