How Big Is Your Reach? Pincode-Level Grocery Delivery Coverage Across India 19,000+ Pin Codes

Introduction
India’s grocery delivery ecosystem has grown rapidly, but the real question for brands, aggregators, and quick commerce planners is simple: how far does your service truly reach? Delivery coverage is no longer measured only by city names. This is where Pincode-Level Grocery Delivery Coverage Across India becomes a powerful metric for understanding expansion gaps and service performance.
From metro hubs like Mumbai and Delhi to fast-developing Tier-2 and Tier-3 cities, delivery availability differs drastically even within the same district. A single city can have high-density zones fully serviceable, while nearby residential areas remain uncovered.
To build accurate insights, companies increasingly depend on Grocery Data Scraping for real-time tracking of serviceable pin codes, delivery speed, product availability, and platform penetration. In this blog, we will break down grocery delivery availability trends across 19,000+ pin codes, highlight actionable stats, and provide structured comparisons with tables for better clarity.
Measuring Service Reach Through Local Pin Codes
India’s quick commerce market is expanding fast, but real growth is measured at the micro-market level. A proper India Grocery Delivery Coverage by Pincode assessment shows that even within a single city, certain residential clusters receive fast delivery while nearby outskirts remain uncovered.
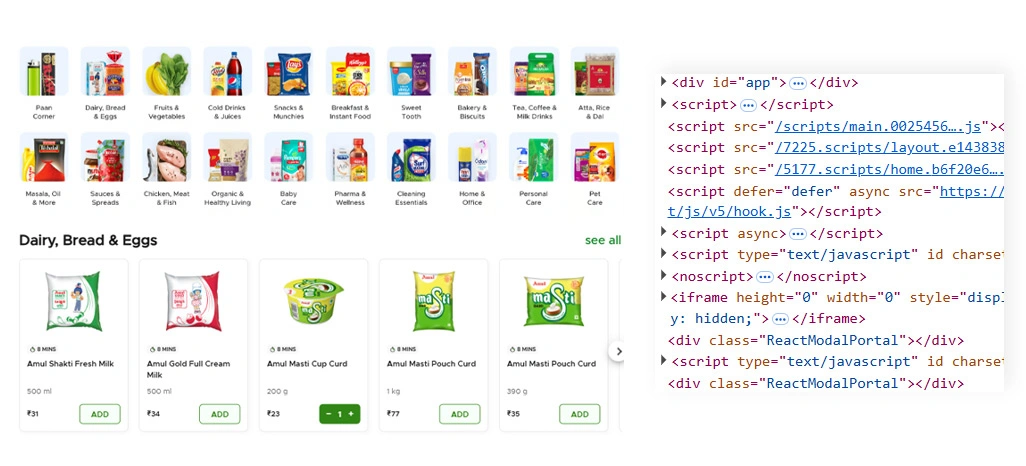
In major metros, the majority of pin codes show strong order volume due to dense housing societies, office zones, and higher purchasing power. To build a structured view, analysts frequently create a Blinkit Zepto Instamart Bigbasket Coverage Map that highlights which pin codes are fully serviceable, partially serviceable, or not serviceable at all.
Businesses also depend on a Grocery Scraping API to track availability updates, delivery promises, and category-level access in real time. This is crucial because serviceable zones often change due to dark store relocation, operational capacity, and seasonal demand spikes.
Pincode Coverage Snapshot Table:
| Coverage Factor | Typical Observations Across India |
|---|---|
| Total pin codes tracked | 19,000+ |
| Active delivery pin codes | 12,000–14,500 |
| High-density delivery clusters | Metro city regions |
| Partial service zones | City outskirts |
| Low coverage zones | Smaller towns and rural edges |
By focusing on pincode-based mapping, businesses can identify service gaps early and prioritize expansion into demand-heavy zones with minimal competition. The key advantage of pincode-level monitoring is that it reveals hidden expansion gaps that city-level reports cannot detect.
Evaluating Competitive Coverage Differences Across Platforms
India’s grocery delivery market is highly competitive, but platform strength varies significantly across localities. A city might appear fully covered, yet different apps dominate different pin code clusters. This is why businesses rely on Blinkit Zepto Instamart Bigbasket Pincode Delivery Comparison to identify who holds the strongest operational footprint.
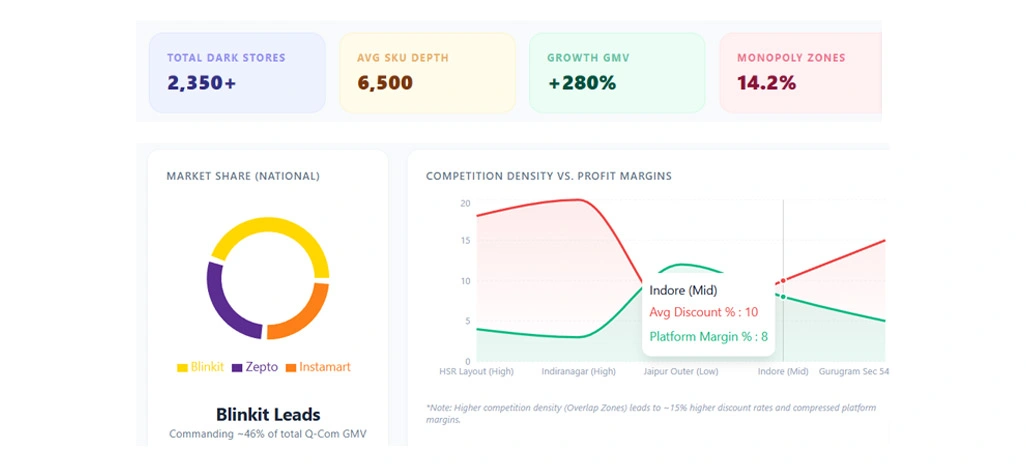
In metro cities, overlap is intense because multiple apps compete in the same high-order areas. In Tier-2 and Tier-3 markets, however, the pattern is very different. This is where a Data-Driven Analysis of Grocery Delivery Reach in India becomes important, because it provides visibility into overlap zones, monopoly zones, and future growth markets.
For retail brands and analysts, coverage density is directly connected to promotions and margins. In high-competition pin codes, platforms usually offer more discounts and faster delivery to retain customers. This creates better opportunities for consumers to conduct Price Comparison across multiple apps.
Competitive Coverage Comparison Table:
| Platform | Coverage Strength | Most Common Coverage Type | Expansion Focus |
|---|---|---|---|
| Blinkit | Strong in dense metros | Fast delivery zones | High-order clusters |
| Zepto | Rapidly scaling network | Premium metro pin codes | Aggressive rollout |
| Instamart | Stable in city centers | Quick commerce pockets | Selective growth |
| BigBasket | Wider reach model | Scheduled delivery zones | Consistent expansion |
Such analysis helps businesses clearly compare platform reach and plan market entry strategies based on actual serviceable zones rather than assumptions. On the other hand, in limited-service zones, the available platform can maintain stable pricing due to reduced competitive pressure.
Finding Coverage Gaps and Untapped Areas
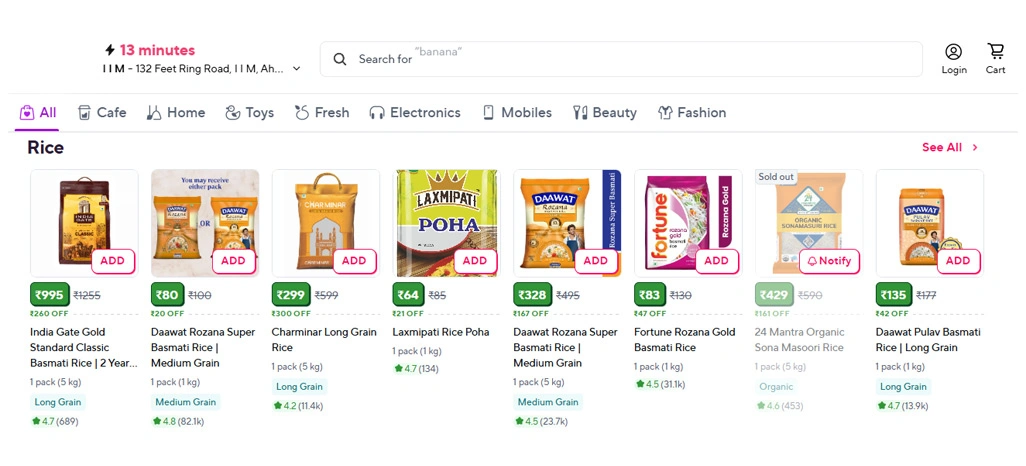
Mapping delivery reach at the pin code level has become essential for grocery platforms and brands because growth is no longer city-based. Consumers frequently search Which Grocery App Delivers to My Pincode before choosing where to order. This behavior has made availability mapping a powerful indicator of both customer demand and market penetration.
Many companies now use Map Grocery Delivery Availability by Pincode techniques to identify service gaps that are hidden within major cities. It is common to see coverage islands where one pin code receives 10–20 minute delivery while nearby pin codes remain uncovered.
For users, the simplest need is understanding How to Check Grocery App Delivery in Your Pincode, but for businesses, the same question becomes a strategic expansion signal. Brands also study Grocery Delivery Availability India by Area to decide where product visibility is strongest and where distribution partnerships should be improved.
Coverage Gap Classification Table:
| Coverage Type | Description | Business Opportunity |
|---|---|---|
| High overlap zones | Multiple apps active | Competitive pricing battles |
| Moderate overlap zones | 1–2 apps active | Strong expansion potential |
| Partial coverage zones | Limited categories/slots | Warehouse optimization scope |
| No coverage zones | No service available | Untapped future growth |
To strengthen decision-making, analysts combine coverage monitoring with a Grocery Price Scraper, allowing them to link availability insights with product stock and pricing shifts.
How Retail Scrape Can Help You?
We provide automated solutions that monitor coverage shifts across India, ensuring your business always has updated visibility into Pincode-Level Grocery Delivery Coverage Across India without manual tracking.
What we provides:
- Real-time serviceability monitoring across multiple apps.
- City and pincode-level expansion tracking reports.
- Coverage overlap benchmarking across competitors.
- Historical delivery footprint datasets for trend analysis.
- Custom dashboards for coverage-based growth planning.
- Structured data feeds for internal analytics teams.
By using Web Scraping Grocery Store Datasets in the middle of their data strategy, companies can maintain consistent visibility and make smarter, faster decisions even when platforms update or shift.
Conclusion
India’s grocery delivery market is no longer defined by cities alone, but by how deeply platforms penetrate local communities. When companies track Pincode-Level Grocery Delivery Coverage Across India, they gain a clear understanding of where demand is being served, where competition is intense, and where expansion opportunities still exist.
The ability to validate availability through Blinkit Zepto Instamart Bigbasket Pincode Delivery Comparison also supports better decisions in logistics planning, dark store placement, customer acquisition, and category distribution. Contact Retail Scrape today to access coverage datasets and improve your grocery delivery expansion strategy.