What Insights Does the Flipkart, Amazon, and Myntra Price Comparison Dataset Give on 48% Price Shifts?

Introduction
Understanding price volatility across top marketplaces has become essential for brands navigating today’s aggressive online retail landscape. As frequent price shifts influence consumer decisions, profit margins, and promotional outcomes, businesses now rely heavily on structured data to decode market behavior. A Unified E-Commerce Dataset allows brands to compare pricing patterns, analyze promotional timing, and identify the most responsive product segments across platforms.
With nearly 48% of monitored listings showing frequent adjustments over a 30-day cycle, this dataset helps reveal how retailers react to competitor moves, festive sales, and inventory cycles. By evaluating how prices fluctuate across categories such as electronics, fashion, home essentials, and personal care, brands gain clearer insight into pricing aggressiveness and discount seasonality.
The Flipkart, Amazon, and Myntra Price Comparison Dataset also highlights which platforms consistently offer deeper deals, how dynamic pricing differs during peak events, and what factors influence cross-platform disparities. With the growing importance of price perception in customer decision-making, the Flipkart, Amazon, and Myntra prices serve as an essential foundation for brands seeking clarity, consistency, and competitive advantage.
Evaluating Marketplace Pricing Behaviors Effectively
Understanding marketplace pricing requires more than surface-level observations; it requires consistent tracking of how platforms modify product values across categories and timelines. Many listings undergo frequent adjustments influenced by competition, discount timing, and inventory alignment. By incorporating deeper insights supported through Price Comparison Analytics, businesses can identify patterns that signal category responsiveness, promotional triggers, and platform-specific fluctuations.
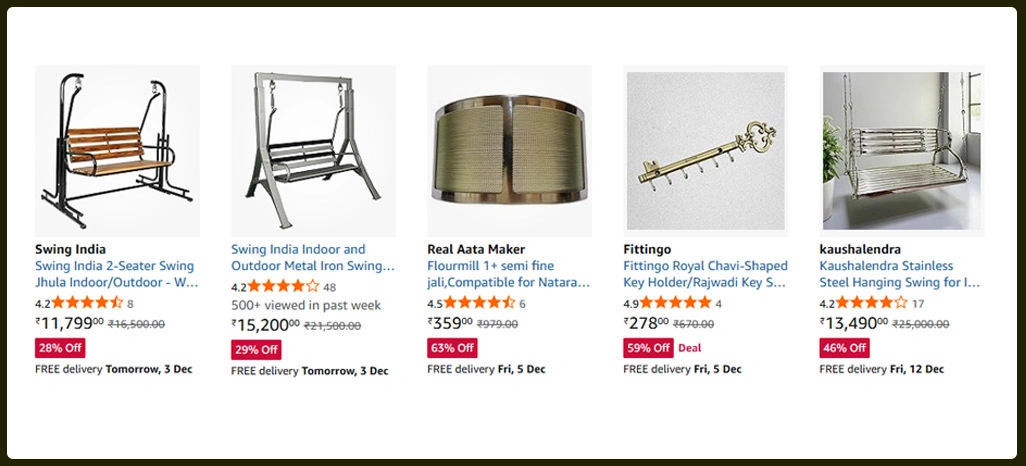
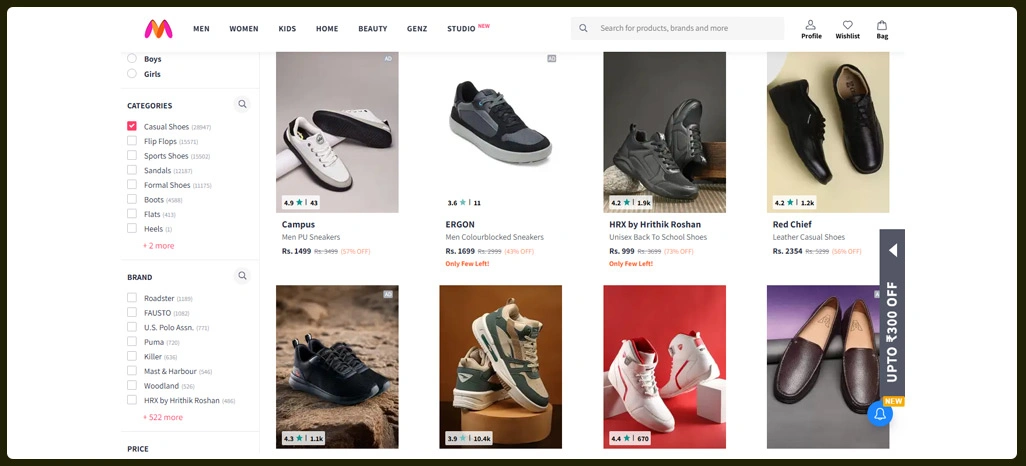
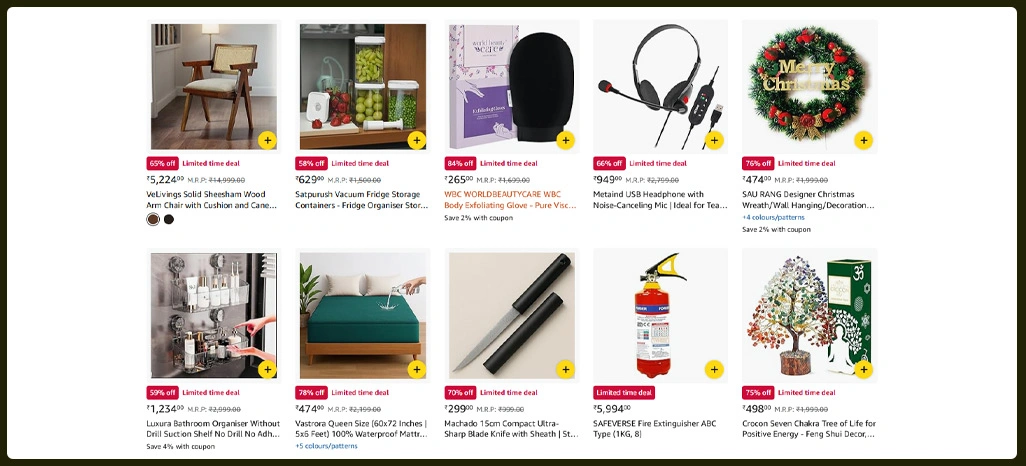
Electronics categories often experience rapid shifts due to high competition and shorter product cycles. Fashion pricing follows a more seasonal approach, where volatility increases during major campaigns. Home essentials, however, remain comparatively stable but still show noticeable variation during festival periods. A consolidated view of these changes provides brands with stronger decision-making clarity.
| Category | Avg. Monthly Price Shifts | Highest Volatility Platform | Typical Reduction % |
|---|---|---|---|
| Electronics | 10–14 | Amazon | 18–32% |
| Fashion | 7–9 | Myntra | 22–38% |
| Home Essentials | 5–7 | Flipkart | 12–20% |
When businesses evaluate these fluctuations collectively, they can adjust listing strategies, plan promotions better, and align discount timing with real market behavior. These insights support structural improvements in pricing decisions that reduce risks and strengthen overall performance.
A refined understanding of comparative movements also helps identify emerging trends across categories, allowing teams to respond faster. Over time, this framework shapes a smarter Competitive Pricing Strategy that adapts to diverse market conditions with greater precision and clarity.
Analyzing Cross-Platform Discount Movements Strategically
Discount patterns across retail platforms follow distinct cycles, and understanding these cycles becomes essential when planning category-specific or brand-wide promotions. When evaluated through consistent tracking, discount intervals reveal how often platforms initiate markdowns, how aggressively they modify them, and which categories receive the most focus. Insights shaped through structured Online Marketplace Price Monitoring highlight the cadence of these movements and reveal cross-platform differences that impact buying behavior.
Different platforms follow distinct discount behaviors—some maintain gradual, consistent markdowns, while others depend on brief but high-impact promotions. By using a Unified Dataset for Monitoring Discount Trends on Major Marketplaces, brands can interpret these variations more accurately and shape promotional strategies that align with real consumer responses.
| Marketplace | Avg. Discount Trigger Interval | Peak Event Impact | Discount Consistency |
|---|---|---|---|
| Flipkart | Every 5–7 days | Moderate | Stable |
| Amazon | Every 3–5 days | High | Variable |
| Myntra | 10–15 days | Very High | Seasonal |
When brands analyze discount rhythms collectively, they gain visibility into which categories require heavier promotions and which respond well to mild adjustments. This enables better budgeting, optimized timing, and reduced inefficiencies in campaign planning.
These insights help teams determine the relationship between platform behavior and customer response, enabling more structured decision-making. By combining timing patterns, category performance, and promotional triggers into one analytical view, brands strengthen their planning accuracy backed by clear marketplace evidence. This streamlined understanding supports long-term efficiency shaped through Benefits of Unified E-Commerce Datasets for Price Intelligence.
Measuring Discount Performance Across Categories Thoroughly
Discount performance varies widely across categories, and understanding these variations requires structured tracking of how different platforms influence consumer actions. When insights are consolidated into comparative datasets, business teams can evaluate which products respond strongly to markdowns and which require additional strategic drivers. By integrating deeper observations modeled through E-Commerce Data Scraping Service India, brands gain a sharper understanding of how pricing, timing, and promotional depth interact across categories.
Electronics typically see moderate-to-high response rates during shorter discount bursts, while fashion categories benefit more from larger, seasonal markdowns. Home essentials maintain consistency but still show increased conversions when accompanied by platform-driven cashback or bundle offers.
| Category | Avg. Conversion Lift | Ideal Discount Range | High-Response Platforms |
|---|---|---|---|
| Electronics | 22–28% | 10–18% | Amazon & Flipkart |
| Fashion | 30–44% | 15–35% | Myntra |
| Home Essentials | 15–20% | 8–15% | Flipkart |
Such structured insight helps brands identify growth opportunities, evaluate high-performing items, and refine promotional direction. Over time, the refined visibility helps improve planning accuracy and maximize profitability supported by Dataset for Analyzing E-Commerce Discounts and Deals. This enhanced clarity shapes targeted actions aligned with real consumer behavior.
How Retail Scrape Can Help You?
Retail brands often face challenges in making sense of fragmented pricing structures spread across multiple platforms. With rich analytical workflows centered around the Flipkart, Amazon, and Myntra Price Comparison Dataset, Retail Scrape provides a more unified, actionable, and accurate approach to understanding price movements.
Our approach includes:
- Helps identify product-level pricing gaps.
- Tracks cross-platform volatility for smarter decisions.
- Monitors discount timing and promotional outcomes.
- Supports category-specific analysis for planning.
- Enables structured competitive evaluation.
- Provides customizable reporting for team alignment.
By integrating these capabilities into daily workflows, Retail Scrape ensures brands operate with complete marketplace visibility. The approach brings clarity to cross-platform decision-making while improving long-term planning supported by one structured view of market behavior aligned with a Multi-Platform Product Comparison perspective.
Conclusion
Market competition continues to shape how products are priced across India’s retail ecosystem, and structured analysis becomes essential for creating efficient strategies. With precise evaluation powered by the Flipkart, Amazon, and Myntra Price Comparison Dataset, brands get a much clearer understanding of marketplace movements, category volatility, and promotional strengths.
A clearer understanding of pricing and discount response behaviors helps companies unlock smarter decisions, optimize listings, and improve outcomes. The precision offered through detailed evaluation helps strengthen decision accuracy aligned with Benefits of Unified E-Commerce Datasets for Price Intelligence. Connect with Retail Scrape today for detailed, data-driven pricing clarity.