
How Do Dussehra Grocery Product Trends Reveal What Shoppers Buy Most on Blinkit, Zepto and Instamart?
Introduction
Dussehra brings noticeable changes in grocery shopping as households prepare for religious ceremonies, family gatherings, festive meals, and celebrations. Quick-commerce platforms such as Blinkit, Zepto, and Swiggy Instamart make it convenient to order everyday essentials and festive ingredients. Monitoring Dussehra Shopping Trends helps retailers understand changing consumer preferences and identify products that attract seasonal attention.
During Dussehra, shoppers often purchase sweets, dry fruits, cooking oils, rice, snacks, fruits, and puja essentials. Businesses can analyze Dussehra Grocery Product Trends by tracking product listings, prices, stock availability, and assortment changes across quick-commerce platforms. However, actual sales data provides more reliable insights into purchasing behaviour than listing information alone.
A structured approach to Festival Season Grocery Price and Availability Tracking enables retailers to compare product performance across platforms and observe how shopping patterns change over time. Rather than relying on assumptions about popular items, businesses can combine product-level observations with historical sales records to assess seasonal demand, plan inventory, improve pricing decisions, and prepare for changing customer requirements during Dussehra.
Analysing Grocery Categories and Purchasing Patterns During Dussehra
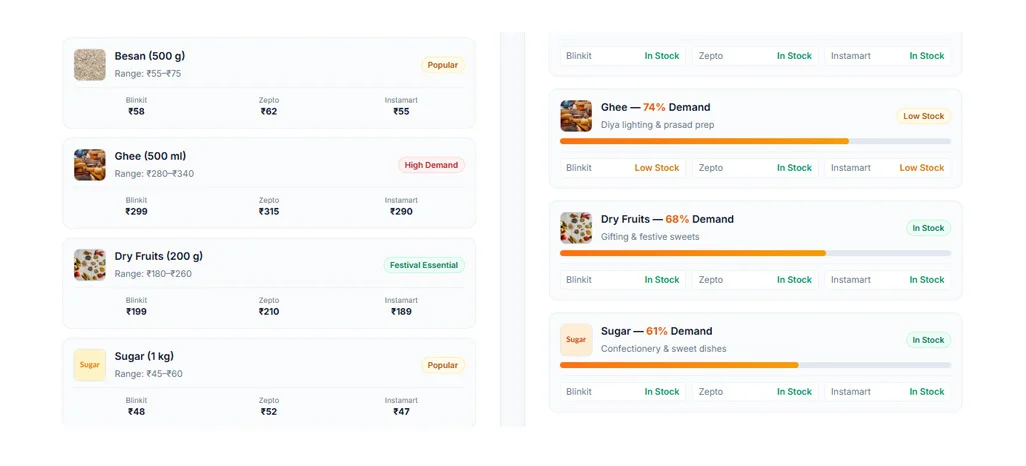
Dussehra shopping often includes everyday staples, festive ingredients, packaged snacks, sweets, and products used for family meals. Retailers can compare these categories across quick-commerce platforms to understand which products receive greater attention during the festive period. Examining product assortment, displayed prices, promotional offers, and stock availability provides a practical starting point for identifying changes in shopping preferences. However, listing frequency alone cannot establish which products generate the highest sales.
Businesses can strengthen their analysis by reviewing historical order volumes, inventory records, and category-level performance. For example, cooking oil, flour, rice, ghee, and dry fruits may be relevant categories to monitor when planning seasonal stock. Grocery Demand Forecasting & Availability becomes more useful when retailers combine these observations with previous festive-season sales and location-specific purchasing records. This approach helps distinguish general product visibility from measurable demand.
The following table outlines categories and indicators retailers can monitor during Dussehra. These are suggested monitoring areas, not verified sales rankings or measured seasonal results.
| Grocery category | Products to monitor | Business application |
|---|---|---|
| Cooking essentials | Oil, flour, rice | Review inventory requirements |
| Festive ingredients | Dry fruits, sugar, ghee | Compare seasonal product movement |
| Snacks and sweets | Namkeen, packaged sweets | Assess promotional activity |
| Fresh produce | Fruits and vegetables | Monitor stock changes |
| Puja essentials | Coconut and listed ceremonial items | Review seasonal assortment |
Retailers can use the collected information to prioritise products for further investigation and inventory planning. Useful activities include:
- Comparing product availability across selected locations.
- Reviewing historical demand during previous festivals.
- Identifying frequently changing product assortments.
- Checking promotional activity across grocery categories.
- Combining listing observations with verified order records.
Consistent monitoring helps businesses make informed decisions without treating assumptions as confirmed customer behaviour.
Comparing Product Assortments Across Blinkit Zepto and Instamart
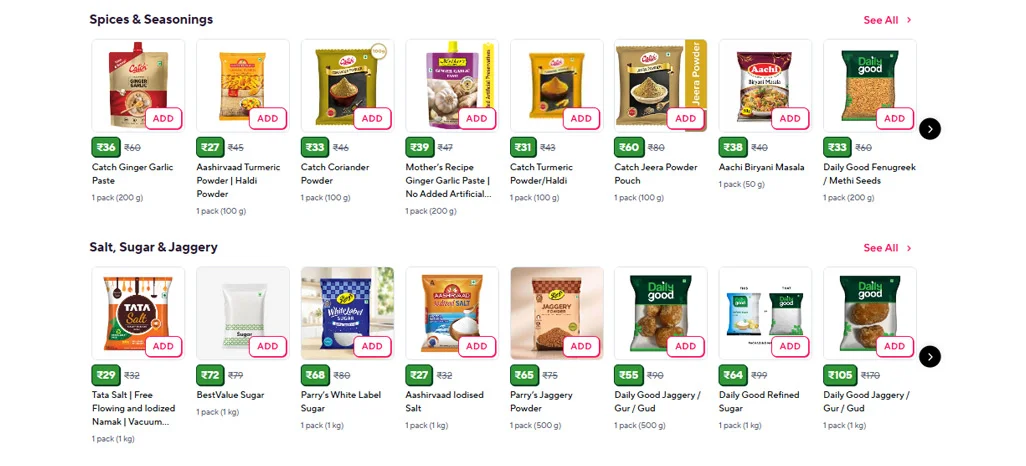
Blinkit, Zepto, and Swiggy Instamart may display different product assortments, prices, discounts, and availability depending on the serviceable location. Comparing Dussehra Product Trends on Blinkit and Zepto with corresponding Instamart listings helps retailers understand differences in product selection and promotional activity. These comparisons are particularly useful when businesses want to evaluate how platforms present similar grocery categories during the same festive period.
Collecting information manually from several platforms can be time-consuming, especially when product listings change throughout the day. Grocery Scraper Services can help collect publicly accessible product information at scheduled intervals, subject to platform access conditions. Structured records make it easier to compare product names, pack sizes, displayed prices, discounts, and stock status across selected locations.
The table below presents a practical framework for comparing information from each platform. It describes the data to examine rather than claiming that any platform performs better or generates higher sales.
| Platform | Data points to compare | Business application |
|---|---|---|
| Blinkit | Listed prices, offers, availability | Review assortment changes |
| Zepto | Product variations, pack sizes | Compare product selection |
| Swiggy Instamart | Discounts, listed categories | Evaluate promotional activity |
Retailers can improve platform comparisons through several activities:
- Compare equivalent products and pack sizes.
- Record observations for consistent geographic areas.
- Monitor displayed prices at comparable times.
- Separate promotional changes from regular pricing.
- Validate product information before preparing reports.
Swiggy Instamart Sales should be assessed using actual transaction records whenever available. Product listings, discounts, and availability can indicate market activity, but they cannot independently confirm order volumes, sales revenue, or the highest-selling platform. Combining comparable product observations with verified business data creates a more reliable foundation for evaluating competitive positioning during Dussehra.
Interpreting Product Data to Understand Festive Shopping Behaviour
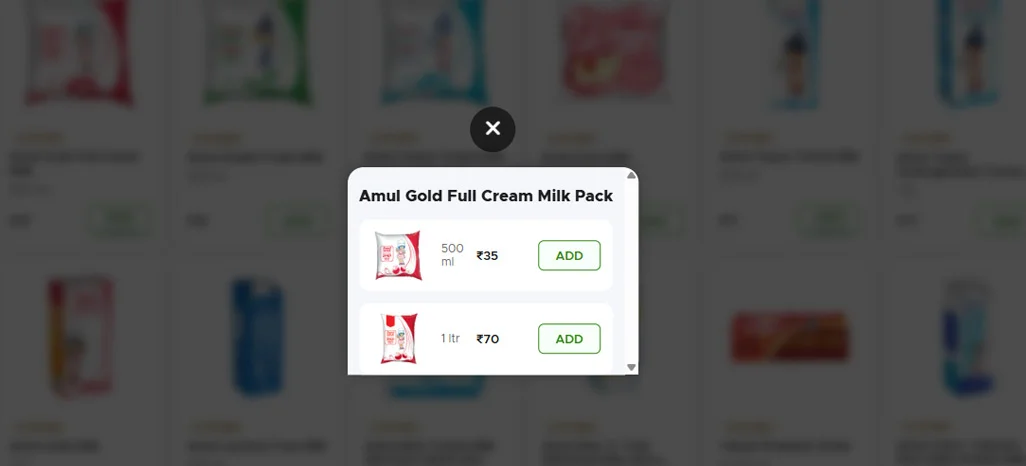
Product-level monitoring helps retailers examine how shopping preferences vary by category, location, pricing, and promotional activity. Blinkit Grocery Demand During Dussehra can be investigated through listing changes, product availability, and price movements. However, these indicators should be interpreted carefully because an increase in listed products does not necessarily mean that more customers are purchasing them. Actual orders and sales records are needed to confirm changes in consumer demand.
Retailers can also evaluate whether product prices and discounts change before, during, and after Dussehra. Quick Commerce Data Intelligence supports this process by organising product observations into comparable datasets for analysis. When businesses combine these datasets with internal inventory records and historical transactions, they can identify recurring patterns, evaluate promotional strategies, and assess whether stock changes correspond with purchasing activity. This supports more informed merchandising decisions without relying solely on assumptions.
The following table illustrates how retailers can interpret common product-monitoring metrics. All numerical values are hypothetical examples created to explain the analysis method.
| Metric | Illustrative observation | Potential application |
|---|---|---|
| Product price | ₹120 to ₹108 | Measure a 10% price reduction |
| Stock availability | Available to unavailable | Flag possible replenishment needs |
| Listed assortment | 40 to 48 products | Measure a 20% increase |
| Discount rate | 5% to 15% | Compare promotional changes |
Retailers can use these observations to investigate seasonal patterns through activities such as:
- Comparing product performance across multiple time periods.
- Reviewing price movements alongside promotional campaigns.
- Identifying repeated stock availability changes.
- Matching product observations with internal sales data.
- Segmenting results by location and grocery category.
These findings can inform future seasonal planning when supported by sufficiently consistent historical data. Festive Grocery Shopping patterns become easier to interpret when retailers distinguish product visibility from actual purchases. Analysing Dussehra Grocery Demand Using Product Data alongside verified order volumes helps businesses evaluate which categories deserve further attention, where stock planning may require adjustment, and how festive purchasing behaviour differs across locations.
How Retail Scrape Can Help You?
Retailers need consistent product information to understand changing grocery preferences and evaluate festive-season competition. We help businesses monitor publicly accessible product information across selected quick-commerce platforms and organise it for analysis. These capabilities support Dussehra Grocery Product Trends analysis without assuming that listed products automatically represent confirmed sales.
The collected information can also be combined with internal sales records to support more complete business analysis.
- Monitor grocery prices across selected quick-commerce platforms.
- Track product availability and changes in listed assortment.
- Compare discounts, offers, pack sizes, and product variations.
- Organise category-level information for seasonal comparisons.
- Identify listing changes that may require inventory checks.
- Prepare structured datasets for pricing and merchandising analysis.
Businesses can use these datasets alongside internal sales, inventory, and order records to develop a clearer understanding of seasonal purchasing behaviour. Where supported by the relevant integration, a Grocery API can help deliver structured product information to existing analytics systems, dashboards, and reporting workflows.
This approach supports Festive Grocery Demand on Quick Commerce Apps analysis by providing comparable product-level observations across selected platforms and locations. We can help businesses organise the information required for data-driven retail planning, while actual demand forecasting still depends on appropriate historical sales data, order volumes, inventory records, and other relevant business inputs.
Conclusion
Combining product-level observations with verified sales records enables businesses to identify meaningful seasonal patterns, evaluate customer purchasing behaviour, and make better-informed decisions about inventory, pricing, and product selection. Dussehra Grocery Product Trends help retailers examine how festive shopping affects grocery assortments, pricing, promotions, and product availability across Blinkit, Zepto, and Swiggy Instamart.
Ready to make more informed festive-season decisions? Partner with Retail Scrape to collect structured grocery product data, compare quick-commerce listings, and support data-driven retail planning. Start building a clearer understanding of your market with product monitoring tailored to your business requirements and seasonal objectives.