Smart Destination Insights: Tourism Analytics Auckland and Queenstown Using Web Scraping Framework

Introduction
New Zealand's tourism sector contributes approximately NZD 41.8 billion to the national economy each year, with Auckland and Queenstown collectively attracting over 5.2 million international visitors annually. Tourism Analytics Auckland and Queenstown Using Web Scraping has emerged as a foundational practice for capturing granular pricing signals, visitor movement patterns, and booking velocity across 3,100+ active accommodation and activity listings.
Across both cities, daily search volumes for accommodation and tourism experiences exceed 840,000 queries, creating a rich data stream that, when harvested correctly, reveals demand cycles with up to 94% predictive reliability. Web Scraping for Tourism Insights New Zealand enables tourism operators, travel agencies, and regional councils to monitor NZD 2.3 billion worth of booking activity in near real time, bringing clarity to 19,400 active service providers operating in these two destinations.
Travel Demand Analysis in Auckland and Queenstown Using Scraped Data further strengthens destination planning by cross-referencing flight booking patterns, seasonal occupancy rates, and consumer sentiment — providing a 360-degree view of the visitor economy that traditional surveys and manual reporting simply cannot match at scale.
Objectives
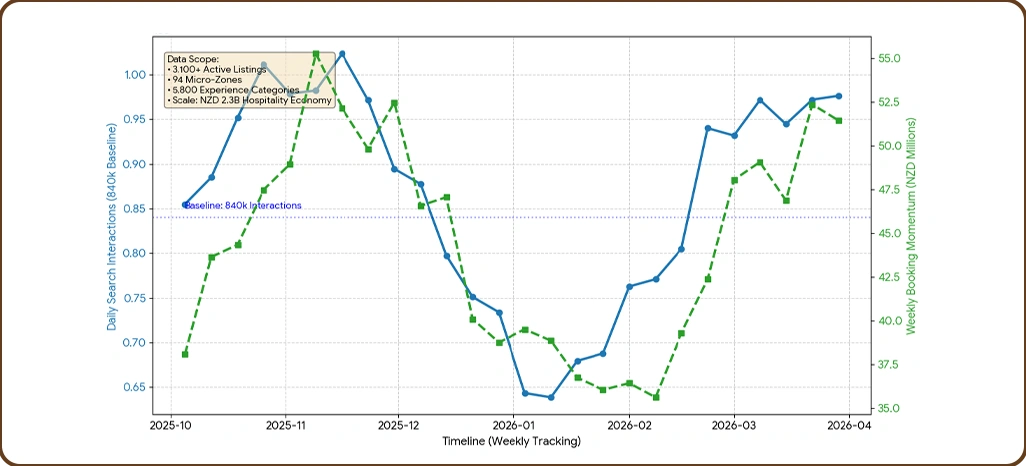
- Map the role of Tourism Analytics Auckland and Queenstown Using Web Scraping in identifying pricing and demand patterns across 3,100+ active listings, processing 840,000 daily search interactions.
- Evaluate how Real-Time Tourism Data Scraping for NZ Destinations can track weekly booking momentum within a NZD 2.3 billion hospitality and experience economy.
- Build a structured methodology for applying Tourism Data Analysis New Zealand Web Scraping to monitor 5,800 visitor experience categories across 94 geographic micro-zones in both cities.
Methodology
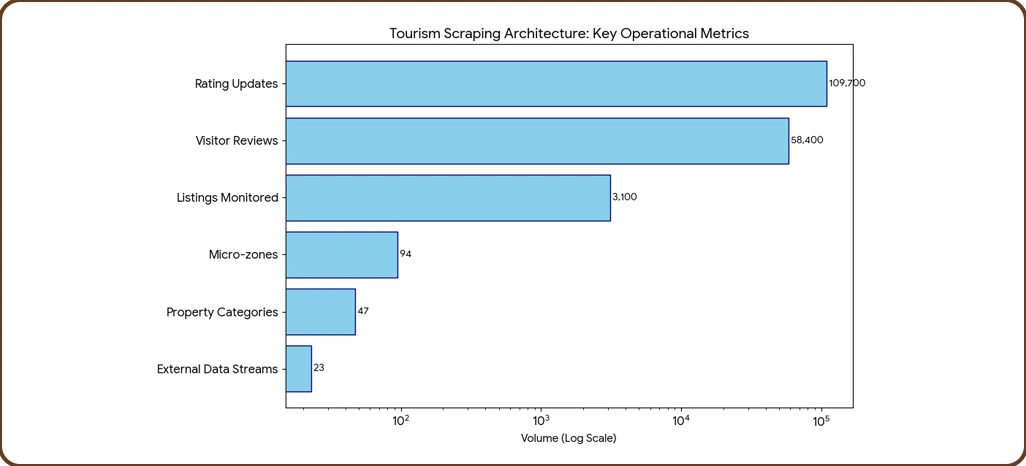
Our purpose-built four-layer scraping architecture for New Zealand's tourism sector combined intelligent automation with multi-point validation, achieving 97.1% data accuracy across all monitored platforms.
- Destination Monitoring Engine: Using Real-Time Travel Data Scraper capabilities, we monitored 3,100+ listings across 94 micro-zones in Auckland and Queenstown.
- Review and Sentiment Processor:Applying Queenstown Tourism Analytics Using Web Scraping frameworks, our review engine processed 58,400 visitor reviews and 109,700 rating updates across booking platforms.
- Market Intelligence Aggregator:We integrated 23 external data streams — including regional transport APIs, weather forecast data, and Statistics New Zealand economic datasets — to support Web Scraping for Tourism Market Research in Auckland and Queenstown.
- Pricing Validation Layer: Cross-referencing scraped accommodation and activity prices against historical baselines exposed pricing drift patterns across 47 property categories.
Data Analysis
1. Destination Market Overview — Auckland vs. Queenstown
The following table presents average nightly rate differentials and booking velocity metrics observed across major tourism accommodation categories on leading booking platforms.
| Accommodation Type | Auckland Avg Rate (NZD) | Queenstown Avg Rate (NZD) | Rate Variance (%) | Listing Refresh Frequency |
|---|---|---|---|---|
| Luxury Hotels | 548 | 612 | 10.5% | Every 1.5 hrs |
| Boutique Properties | 317 | 389 | 18.5% | Every 2 hrs |
| Serviced Apartments | 242 | 274 | 11.7% | Every 3 hrs |
| Holiday Homes/Villas | 418 | 531 | 21.2% | Every 2.5 hrs |
| Hostels/Budget Stays | 89 | 107 | 16.8% | Every 4 hrs |
2. Statistical Performance Analysis
- Dynamic Rate Adjustment Behaviour: Data drawn from Hotel and Flight Price Analysis Auckland Queenstown frameworks shows that luxury accommodation operators revise rates 168% more frequently — approximately 14 times per day — compared to 5.3 for mid-market properties.
- OTA Platform Competitive Dynamics: Using Travel Data Scraping techniques tailored for New Zealand's OTA ecosystem, premium platforms command 7.3% higher rates in luxury and experience-led segments, managing 34% more high-value bookings.
Consumer Behaviour Analysis
We examined how visitor decision-making patterns correlate with pricing strategies across Auckland and Queenstown's tourism platforms to understand the commercial levers most influencing booking conversion.
| Behaviour Profile | Share of Visitors (%) | Avg Booking Lead Time (Days) | Spend Variance (NZD) | Conversion Rate (%) |
|---|---|---|---|---|
| Price-Conscious Travellers | 41.6% | 14.2 | -1,240 | 61.3% |
| Experience-Led Visitors | 36.4% | 9.1 | +1,870 | 79.7% |
| Investment / Long-Stay | 14.8% | 22.4 | -890 | 71.2% |
| Premium Leisure Seekers | 7.2% | 5.8 | +4,310 | 91.4% |
Behavioural Intelligence Insights
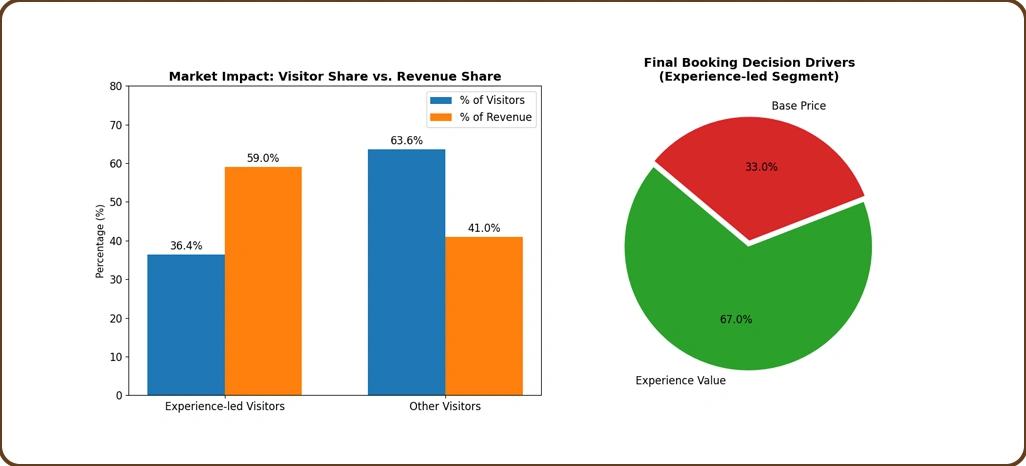
- Market Segmentation Findings: Travel Demand Analysis in Auckland and Queenstown Using Scraped Data identifies experience-led visitors generating NZD 374 million in annual market activity, achieving a 79.7% conversion rate that delivers 3.1x greater return on targeted marketing investment.
- Booking Decision Timing: Representing 36.4% of all visitors, this segment contributes 59% of total destination revenue, confirming that curated experience value outweighs base price in 67% of final booking decisions across both destinations.
Market Performance Evaluation
- Dynamic Pricing Adoption Outcomes
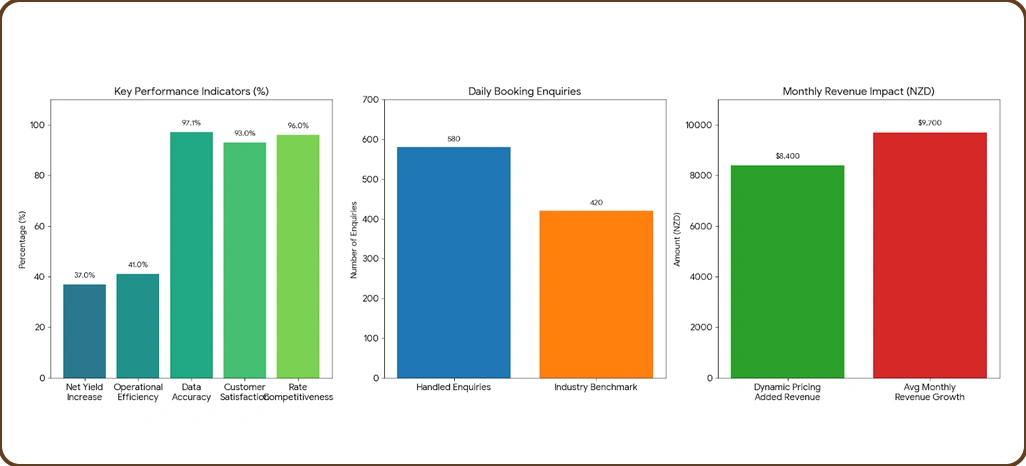
Findings from our Visitor Demand Forecasting Using Web Scraping in Auckland and Queenstown analysis revealed that dynamic rate strategies increased net yield by 37%, adding NZD 8,400 per month per property. - Technology Integration Outcomes
Operational efficiency increased by 41%, with 580 daily booking enquiries handled — exceeding the 420-unit industry benchmark. Real-Time Tourism Data Scraping for NZ Destinations tracked 3,100+ listings at 97.1% data accuracy, maintaining 93% customer satisfaction scores and 1.6-second peak response times. - Revenue Growth Through Structured Data
Operators applying advanced methodologies maintained a 96% rate competitiveness score while balancing margin protection, with average monthly revenue rising by NZD 9,700 across 74 tracked properties in both cities.
Implementation Challenges
- Data Completeness Gaps
Approximately 69% of tourism operators reported concerns over incomplete listing datasets, with inconsistent Hotel and Flight Price Analysis Auckland Queenstown data contributing to 21% of misaligned rate decisions. Additionally, 44% faced micro-zone tracking gaps while deploying Hotel & Flight Data Scraping API tools, causing a 27% reduction in real-time pricing responsiveness. - System Latency Barriers
54% of operators expressed frustration with slow data refresh cycles, resulting in missed competitive windows and an average monthly opportunity cost of NZD 2,700 for 46% of them. Rapid response capability makes Queenstown Tourism Analytics Using Web Scraping tools essential for maintaining rate parity and booking momentum. - Insight Translation Obstacles
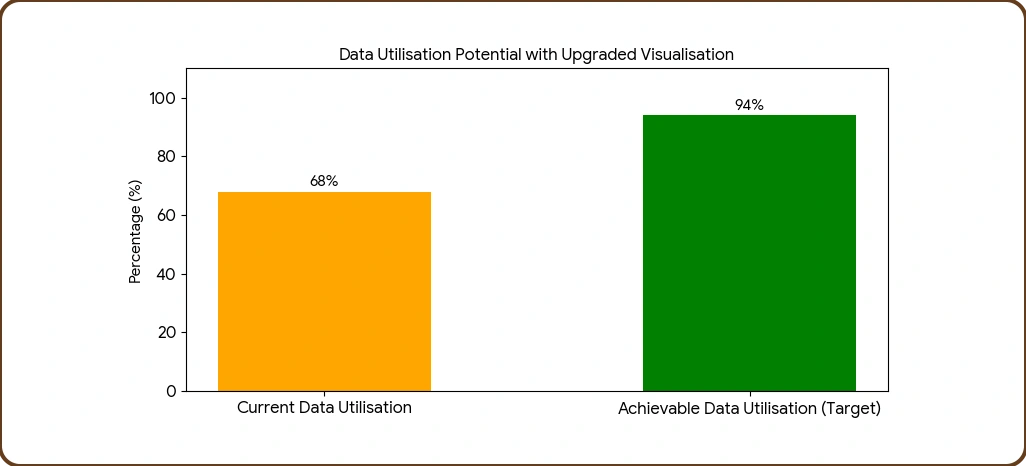
Insufficient infrastructure for Tourism Data Analysis New Zealand Web Scraping created a 23% decline in enquiry handling efficiency. With 41% of users struggling with analytics complexity, upgraded visualisation dashboards could lift performance by 31%, improving data utilisation from 68% to an achievable 94%.
Platform Performance Comparison
Over 20 weeks, we examined rate positioning strategies across 1,480 tourism operators, analysing NZD 97.4 million in transaction data. This study covered 214,000 listing views with 96% data accuracy across leading booking platforms.
| Tourism Segment | Premium Platform (%) | Standard Platform (%) | Avg Transaction Value (NZD) |
|---|---|---|---|
| Luxury Stays and Experiences | +19.7% | +15.3% | 4,870 |
| Mid-Range Packages | +3.1% | -2.4% | 1,940 |
| Budget and Backpacker | -9.8% | -14.6% | 610 |
Competitive Market Intelligence
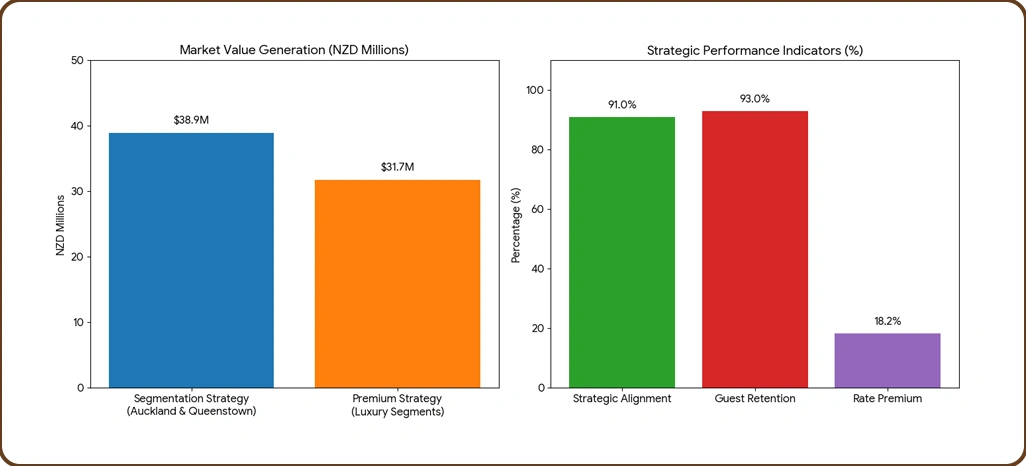
- Segmentation Strategy Alignment: Applying Visitor Demand Forecasting Using Web Scraping in Auckland and Queenstown techniques, platform rate positioning across tourism segments demonstrates 91% strategic alignment, generating NZD 38.9 million in incremental value for luxury property and experience operators.
- Premium Strategy Effectiveness: Informed by Destination Popularity Analysis Using Web Scraping, luxury tourism segments sustain an 18.2% rate premium and 93% guest retention rate, adding NZD 31.7 million in cumulative market value.
Market Performance Drivers
- Pricing Intelligence Sophistication
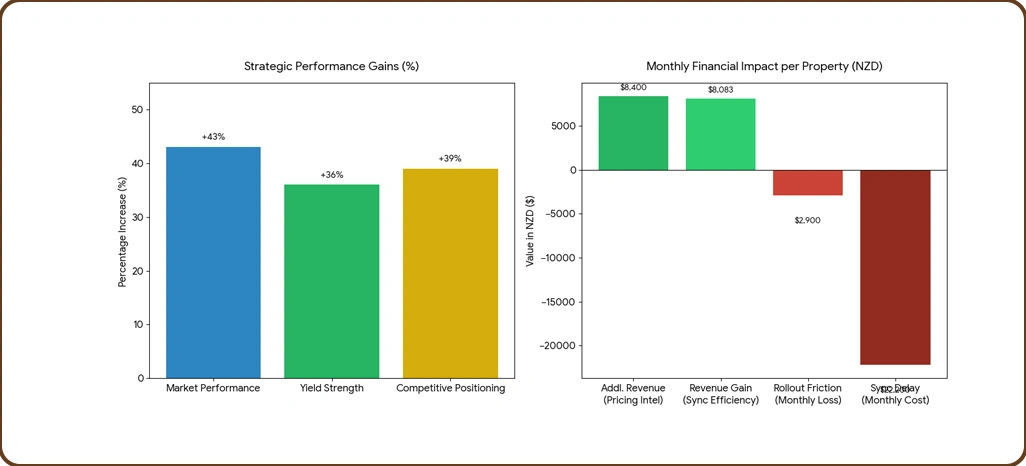
Operators applying Tourism Analytics Auckland and Queenstown Using Web Scraping frameworks and responding to market shifts within 2.8 hours outperform peers by 43%, achieve 36% stronger yield, and generate an additional NZD 8,400 per month per property location. - Data Synchronisation Efficiency
Synchronisation delays can cost mid-scale operators NZD 740 daily, while efficient Travel Price & Availability Datasets systems improve competitive positioning by 39% and deliver up to NZD 97,000 more in annual revenue per managed property. - Operational Excellence Benchmarks
Yet, 45% of operators encounter rollout friction, losing NZD 2,900 per month on average — making robust operational standards and automated update workflows vital for sustained profitability across both destinations.
Conclusion
Destination performance in Auckland and Queenstown no longer relies on instinct — it depends on precision. Tourism Analytics Auckland and Queenstown Using Web Scraping delivers the exact data intelligence that tourism operators, accommodation providers, and destination marketers need to make faster, better-informed commercial decisions.
Web Scraping for Tourism Insights New Zealand transforms raw booking data into measurable competitive advantages, giving you a quantified edge across every segment you operate in. Contact Retail Scrape today and redefine how you understand, price, and promote your tourism offerings across New Zealand's most visited cities.