How can Blinkit vs Zepto Price Volatility Comparison Track 32% Real-Time Price Gaps and Rapid Fluctuations?

Introduction
India’s quick commerce ecosystem is growing at a record pace, but with that growth comes pricing chaos. Consumers now compare grocery prices across multiple apps within seconds, and brands are constantly challenged to maintain margins while still remaining competitive. This is where Blinkit vs Zepto Price Volatility Comparison becomes a critical business strategy rather than just a pricing exercise.
Industry observations suggest that grocery categories such as dairy, snacks, beverages, and fresh produce can show up to 20%–32% price variation within the same day across different pin codes. These rapid shifts make it difficult for retailers, D2C brands, and FMCG companies to track true market positioning.
When pricing teams rely only on manual checks, they often miss short-term discounts, sudden flash sales, and stock-driven price jumps. This results in delayed reactions, poor promotional planning, and revenue loss. By applying structured analytics and automation, businesses can capture real-time price gaps, measure volatility, and predict fluctuations more accurately.
Detecting Location-Based Pricing Differences Instantly
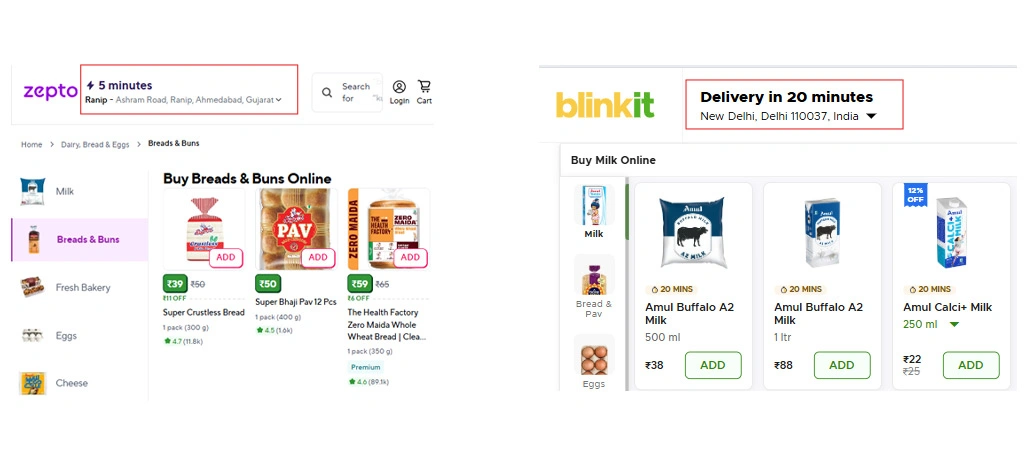
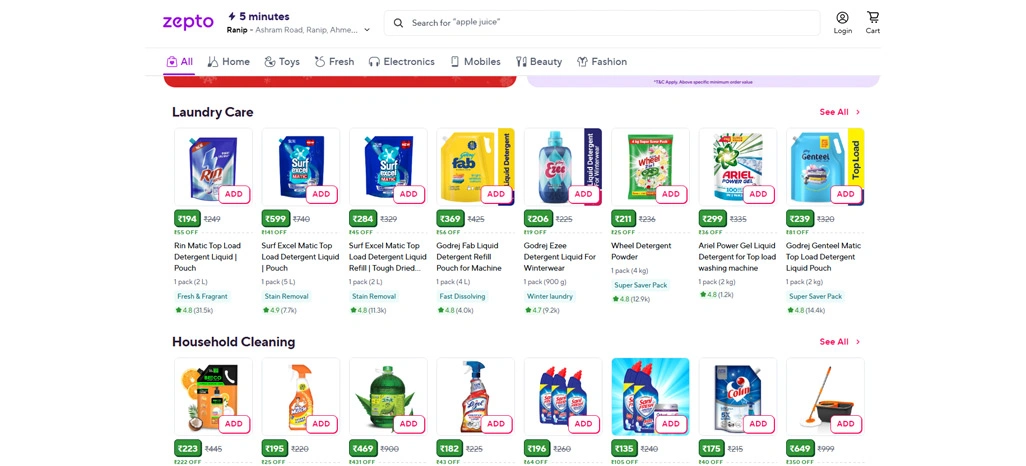
Quick commerce pricing is rarely uniform across India. The same grocery item may appear at different prices depending on city, locality, and even delivery zone. This happens because platforms adjust rates dynamically based on demand spikes, hyperlocal inventory availability, and competitor promotions.
To solve this challenge, retailers must rely on automated tracking models that capture pricing at regular intervals and across multiple pin codes. This is where Quick Commerce Price Volatility Data becomes essential, because it helps brands measure real pricing movement instead of relying on random manual checks.
A strong approach is building a system that can highlight sudden price differences, compare average daily pricing across platforms, and flag irregular gaps. With Real-Time Grocery Data API, businesses can create a consistent flow of pricing signals and store historical patterns for deeper forecasting.
Category-Level Price Variation Snapshot:
| Category Type | Average Price Gap (%) | Update Frequency (Per Day) | Common Trigger |
|---|---|---|---|
| Dairy Products | 18% | 5–7 | Demand spikes |
| Snacks & Biscuits | 22% | 6–8 | Promotions |
| Beverages | 15% | 4–6 | Seasonality |
| Personal Care | 12% | 3–5 | Discount wars |
| Fresh Produce | 28% | 7–10 | Stock pressure |
Accurate visibility also supports smarter benchmarking. When companies build structured reports, they can detect which categories are stable, which are highly volatile, and which zones experience the most competitive discounting.
Capturing Flash Discounts and Sudden Shifts
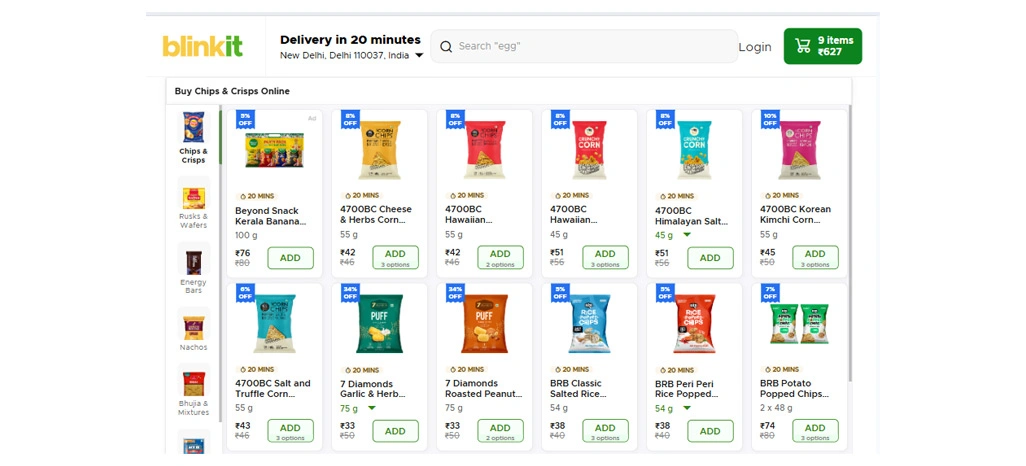
Price volatility in quick commerce is often sudden rather than gradual. Platforms frequently launch short-term campaigns, flash offers, and category-level discounts that can last only a few hours. When brands check pricing once per day, they miss these temporary drops, which directly impacts conversion rates and customer retention.
To improve competitive response time, companies should build automated workflows that collect SKU-level price history, discount patterns, and availability changes. Using Zepto Grocery Data Scraping Services, pricing analysts can also scale monitoring across thousands of products without manual effort.
Such monitoring strengthens planning because it allows brands to measure the true promotional impact and identify which categories are frequently targeted by discount campaigns. Over time, this creates a structured intelligence base that supports more accurate forecasting and better campaign ROI.
Rapid Price Change Tracking Example:
| Product Type | Price Change Pattern | Time Window | Volatility Level |
|---|---|---|---|
| Packaged Snacks | -20% discount | 6 hours | High |
| Cooking Oil | +12% increase | 8 hours | Medium |
| Soft Drinks | -15% flash deal | 4 hours | High |
| Detergent Powder | -10% bundle offer | 10 hours | Medium |
| Baby Care Products | +18% price jump | 12 hours | High |
This makes structured monitoring critical. With Zepto Price Fluctuation Tracking, businesses can detect sudden reductions, spot repeated promotional cycles, and understand when price drops are driven by demand versus inventory.
Turning Price Movement Into Strategy Decisions
Tracking volatility is valuable, but the real advantage comes when brands convert raw pricing signals into strategic action. Pricing intelligence becomes stronger when businesses identify repeated trends, detect competitor behavior patterns, and adjust pricing based on predictable movement cycles.
This is where Dynamic Pricing Comparison Blinkit Zepto supports decision-making by revealing how both platforms behave during demand surges and high-competition timeframes. By applying Data Scraping for Blinkit and Zepto Prices, retailers can detect which products face repeated price drops and which remain stable across cities.
To build a scalable strategy, businesses must understand How to Track Grocery Price Changes on Blinkit using automation that collects pricing, discount rates, and stock signals across multiple locations. With Blinkit Grocery Data Scraping Services, teams can expand coverage across thousands of SKUs while building structured datasets for analysis.
Trend-Based Competitive Insight Table:
| Analysis Type | What It Measures | Business Value |
|---|---|---|
| Daily Price Average | Normal pricing behavior | Benchmarking |
| Discount Frequency | How often offers appear | Promo planning |
| Zone-Based Price Gap | Local pricing differences | City strategy |
| Stock-Out Impact Analysis | Price shifts during low stock | Supply planning |
| Weekly Volatility Pattern | Recurring pricing cycles | Forecasting |
When structured correctly, this monitoring enables teams to Monitor Price Changes on Blinkit and Zepto and build accurate reports for Real-Time Grocery Price Analytics India, while also mapping deeper Blinkit Zepto Pricing Trends across multiple product categories.
How Retail Scrape Can Help You?
Our solutions are designed for brands, FMCG manufacturers, grocery retailers, and analytics firms who want long-term market clarity through Blinkit vs Zepto Price Volatility Comparison. Quick commerce pricing changes are too frequent for manual monitoring, and delayed decision-making directly impacts profit margins.
Key capabilities offered by us:
- Automated collection of product-level pricing data.
- Scheduled tracking for multiple cities and pin codes.
- Competitive benchmarking across platforms.
- Discount and promotion change detection.
- SKU-level historical reporting and trend analysis.
- Custom dashboards for category performance monitoring.
By using these capabilities, brands can react faster to price wars and build structured intelligence for planning. This approach also supports better decision-making for Compare Blinkit and Zepto Pricing Trends across categories and regions.
Conclusion
Businesses that rely on delayed manual tracking often lose visibility into micro-market shifts, promotional cycles, and sudden inventory-driven pricing changes. With Blinkit vs Zepto Price Volatility Comparison, brands can identify daily gaps, measure category fluctuations, and improve decision-making based on real market movement instead of assumptions.
When supported by Monitor Price Changes on Blinkit and Zepto, pricing teams can build smarter forecasting models, reduce competitive blind spots, and optimize product pricing across different cities and pin codes. Contact Retail Scrape today to start your real-time quick commerce price monitoring journey.