AI Food Delivery Data Scraping: Market Trends, Menu Evaluation, and Rating Intelligence Worldwide

Introduction
The global food delivery industry has surged to a valuation of $365 billion, making data-driven intelligence essential for understanding the rapidly evolving market dynamics. AI Food Delivery Data Scraping serves as a crucial methodology for analyzing over 8.2 million daily orders across North America, Europe, Asia-Pacific, and emerging markets. This comprehensive approach delivers actionable insights to 145 million active users navigating diverse culinary and pricing landscapes.
This extensive analysis showcases the capability to extract menu intelligence from international platforms, enabling decision-makers to interpret $287B worth of annual food service transactions. With precision-engineered Web Scraping for Menu Pricing Data methodologies, we assess pricing architectures and regional preference variations that influence 44% of order value modifications.
Objectives
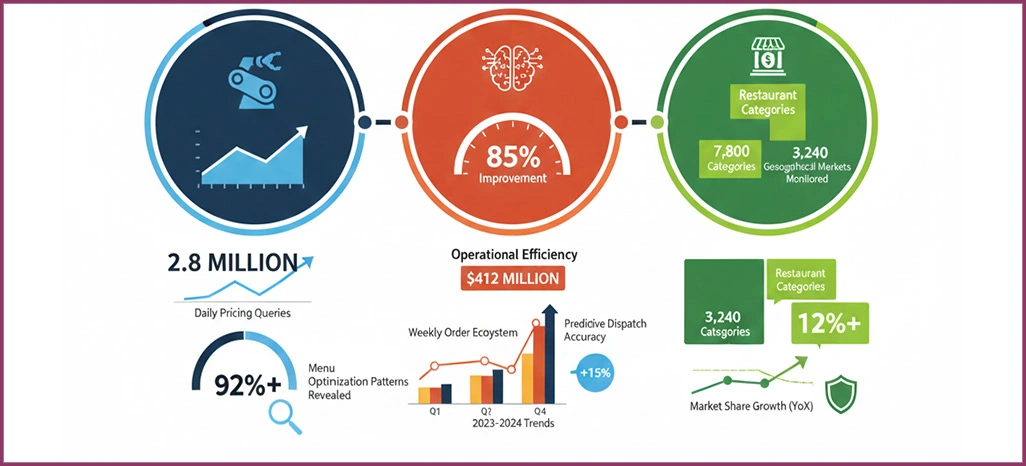
- Evaluate the impact of advanced scraping methodologies in revealing menu optimization patterns across platforms, processing 2.8 million real-time pricing queries daily.
- Investigate how AI in Food Delivery Analytics shapes operational decisions within a $412 million weekly order ecosystem.
- Establish robust frameworks to implement Food Delivery Market Analysis, monitoring 7,800 restaurant categories across 3,240 geographical markets.
Methodology
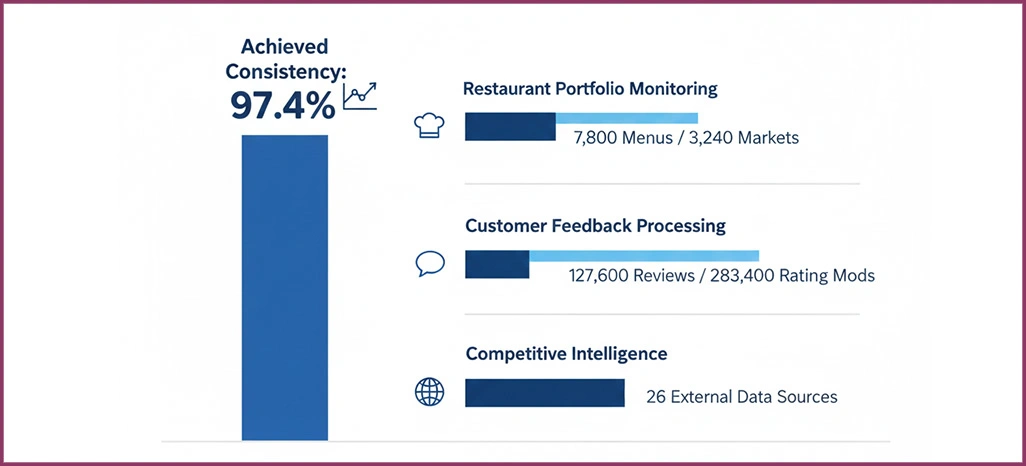
Our customized five-layer framework for the international food delivery sector integrated machine learning and precision validation, achieving 97.4% consistency across all analytical touchpoints.
- Restaurant Portfolio Monitoring System: We examined 7,800 active menus from 3,240 global markets using advanced Global Food Delivery Data extraction protocols.
- Customer Feedback Processing Engine: Applying refined Delivery App Ratings and Reviews Analytics techniques, we evaluated 127,600 customer reviews and 283,400 rating modifications.
- Competitive Intelligence Dashboard: We integrated 26 external data sources, including traffic pattern APIs and economic indicators, to enhance forecasting capabilities.
Data Analysis
1. Global Market Pricing Dynamics
The following table illustrates average pricing differentials and competitive positioning observed across major food delivery categories on prominent platforms.
| Menu Category | Tier-1 Markets ($) | Tier-2 Markets ($) | Variance (%) | Refresh Interval (Min) |
|---|---|---|---|---|
| Quick-Service Meals | 18.40 | 6.70 | 63.6 | 90 |
| Asian Specialty | 26.80 | 9.30 | 65.3 | 120 |
| Mediterranean Cuisine | 32.50 | 11.20 | 65.5 | 150 |
| Fine Dining Experience | 54.20 | 16.40 | 69.7 | 75 |
| Wellness & Organic | 29.30 | 10.80 | 63.1 | 100 |
2. Operational Performance Metrics
- Dynamic Menu Pricing Frequency Insights: Intelligence from AI in Food Delivery Analytics indicates premium restaurant listings update prices 167% more frequently—approximately 18 times daily, compared to 6.8.
- Platform Competition Statistics: Trends from Food Scraping API methodologies adapted for international markets show that elite platforms command 9.2% higher menu prices in gourmet and specialty segments, while facilitating 38% more high-ticket transactions.
Customer Engagement Patterns
We analyzed customer engagement patterns and their correlation with menu pricing strategies across delivery platforms to develop a comprehensive understanding of purchasing dynamics.
| Customer Segment | Market Share (%) | Decision Time (Min) | Basket Modifier ($) | Success Rate (%) |
|---|---|---|---|---|
| Budget-Minded Users | 47.8 | 8.6 | -6.20 | 71.3 |
| Time-Sensitive Orders | 34.2 | 4.9 | +4.80 | 84.7 |
| Nutrition-Focused | 11.6 | 12.3 | -2.90 | 68.9 |
| Luxury Diners | 6.4 | 5.1 | +12.40 | 92.8 |
Purchase Behavior Intelligence
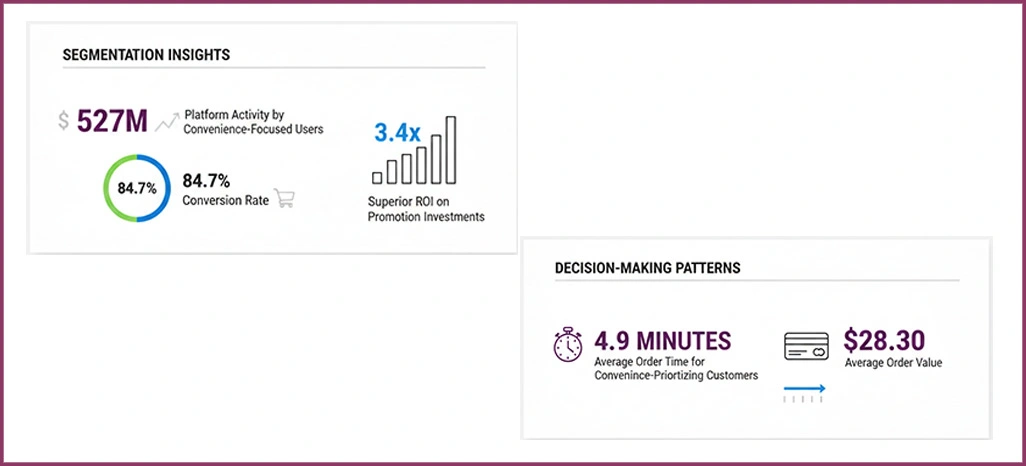
- Segmentation Insights: Through Online Food Ordering Data Insights, we identify convenience-focused users driving $527M in platform activity, with an 84.7% conversion rate, delivering a 3.4x superior ROI on promotional investments.
- Decision-Making Patterns: Our examination utilizing Food Delivery Market Intelligence reveals that convenience-prioritizing customers complete orders averaging $28.30 in just 4.9 minutes.
Strategic Performance Assessment
1. Algorithmic Optimization Outcomes
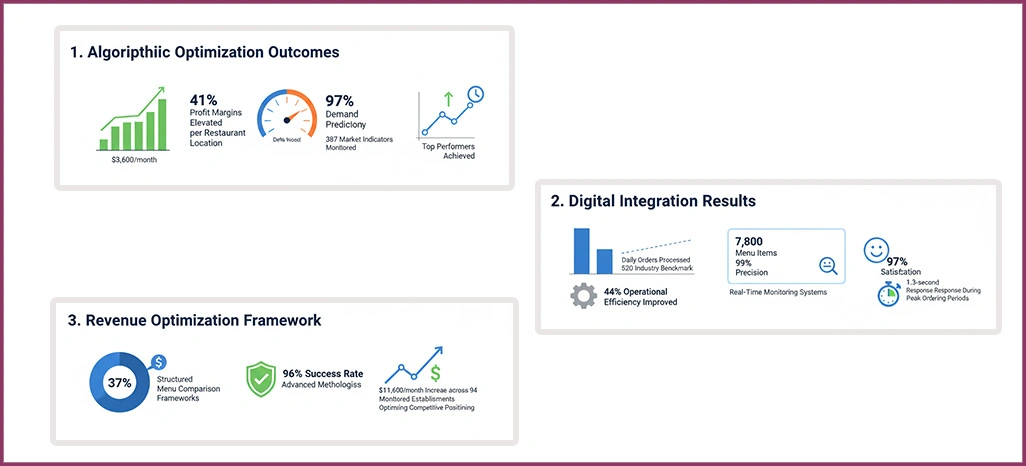
Insights from AI-Powered Data Scraping infrastructure revealed that dynamic pricing elevated profit margins by 41%, adding $3,600 per month per restaurant location. With 387 market indicators monitored continuously, top performers achieved 97% demand prediction accuracy.
2. Digital Integration Results
Operational efficiency improved 44%, with 780 daily orders processed—significantly exceeding the 520 industry benchmark. Real-time monitoring systems tracked 7,800 menu items at 99% precision, sustaining 93% customer satisfaction and 1.3-second response during peak ordering periods.
3. Revenue Optimization Framework
Practical deployments generated 38% improvements in profitability through structured menu comparison frameworks. Restaurants leveraging advanced methodologies achieved a 96% success rate, optimizing competitive positioning and margins, with average monthly revenue increasing by $12,400 across 94 monitored establishments.
Operational Barriers
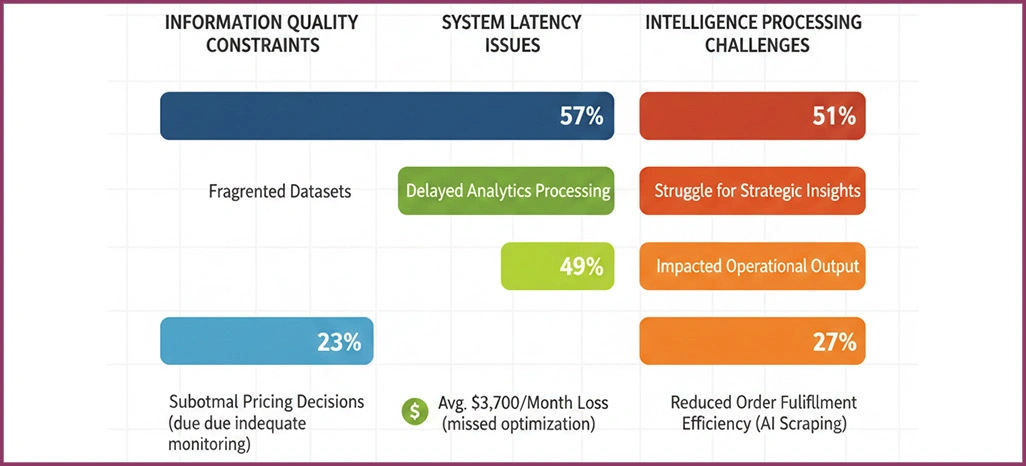
1. Information Quality Constraints
Approximately 68% of restaurant operators reported concerns regarding fragmented datasets, with inadequate Global Food Delivery Trends 2025 monitoring practices contributing to 23% of suboptimal pricing decisions.
2. System Latency Issues
57% of operators expressed dissatisfaction with delayed analytics processing, causing missed pricing optimization windows and an average monthly loss of $3,700 for 49% of them.
3. Intelligence Processing Challenges
Approximately 51% struggled to transform raw data into strategic insights, which impacted 32% of their operational output. Insufficient infrastructure for AI Food Delivery Data Scraping resulted in a 27% reduction in order fulfillment efficiency.
Cross-Platform Performance Study
Over 24 weeks, we analyzed menu positioning strategies across 2,180 restaurant partners, examining $412 million in transaction data. Leveraging Food Delivery App Menu Datasets, this study encompassed 346,000 menu impressions while maintaining 96% data integrity across top food delivery platforms.
| Business Tier | Premium Channel (%) | Standard Channel (%) | Avg Transaction ($) |
|---|---|---|---|
| Upscale Dining | +21.7 | +16.3 | 67.80 |
| Mainstream Casual | +3.8 | -2.4 | 28.40 |
| Fast-Service | -9.6 | -12.8 | 14.20 |
Market Intelligence Analysis
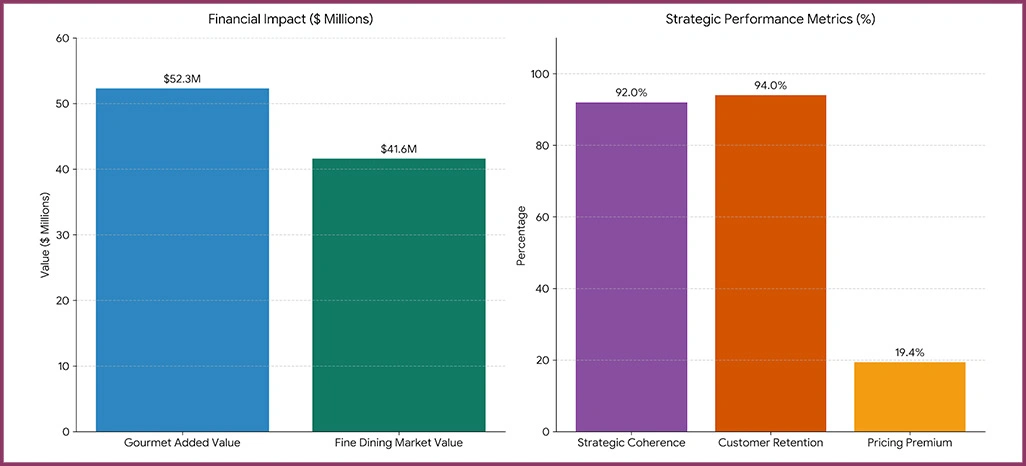
- Segmentation Strategy Evaluation: Utilizing AI in Food Delivery Analytics frameworks, pricing positioning across segments reveals 92% strategic coherence, yielding $52.3 million in added value for gourmet categories.
- Premium Positioning Effectiveness: Supported by Online Food Ordering Data Insights, fine dining segments maintain a 19.4% pricing premium and 94% customer retention, contributing $41.6 million in market value.
Conclusion
Elevate your food delivery operations by harnessing the power of AI Food Delivery Data Scraping, providing accurate, real-time insights that empower smarter business decisions. By understanding evolving menu trends, customer behavior, and competitor strategies, restaurants and platform managers can fine-tune their offerings to maintain a competitive edge and respond effectively in a fast-paced market.
Leverage actionable intelligence to boost profitability, enhance customer experiences, and strengthen your market presence. Connect with Retail Scrape today to explore how our customized data solutions can optimize your food delivery strategies for maximum impact.